Day 2 of #RWRIPPP1 starts with @DrCirillo as promised. He is an R, and also a Mathematica man... So the first minutes are spent explaining the datasets and R packages he will be using. 1/n
First (apparently) trivial advice: plot the data. @DrCirillo tells us he has seen people assuming data was normally distributed working for banks when a simple plot would have shown that the distribution was asymmetric (those people never even bothered plotting the data)... 2/n


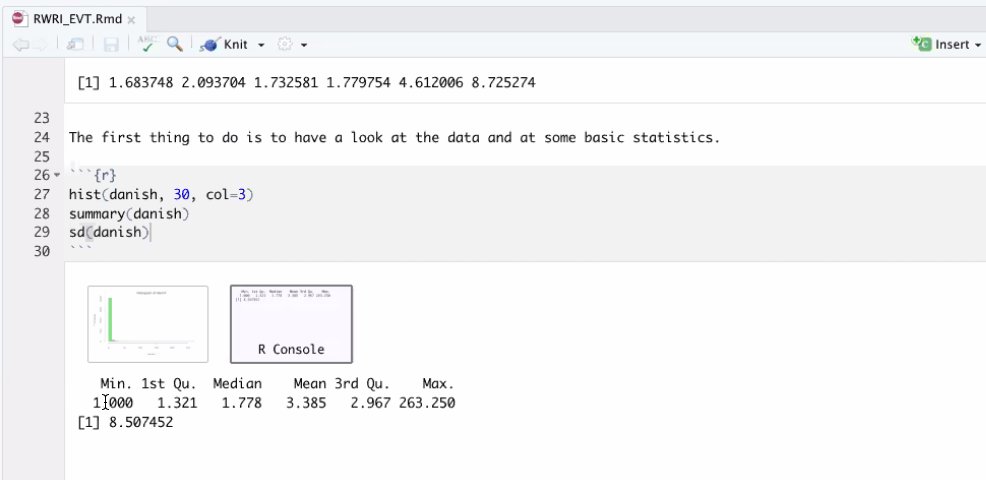
Danish Reinsurance Claim Dset The univariate dataset was collected at Copenhagen Reinsurance and comprise 2167 fire losses over the period 1980 to 1990. They have been adjusted for inflation to reflect 1985 values and are expressed in millions of Danish Krone. Via @joonya__! 3/n
The multivariate data set is the same data as above but the total claim has been divided into a building loss, a loss of contents and a loss of profits. We will be using it to illustrate EVT, by the way (Extreme Value Theory). The bulk (mean, std, etc) of the data isn't... 4/n
the most important part of the data in EVT. It is important only when we have analyzed the tails. Long/fat/heavy/thick tails are not the same things, @DrCirillo invites us to see his videos to understand the difference. 5/n
Thin tailed (normal) decays exponentially. Heavy tailed means that it does not decay exponentially. Pareto or Lognormal are heavy tailed. They are better studied not by their moments as we saw yesterday but by the catastrophe principle (both distributions are subexponential). 6/n
There can be functions that behave like a normal distribution around the mean, but not in the tails. Pasquale Cirillo recommends the book "Modern introduction to probability and statistics". Pareto is a fat tailed power-law, but Lognormal distribution is not fat tailed. 7/n
This is a Pareto, decays as per the exponent within the circle (alpha). 8/n
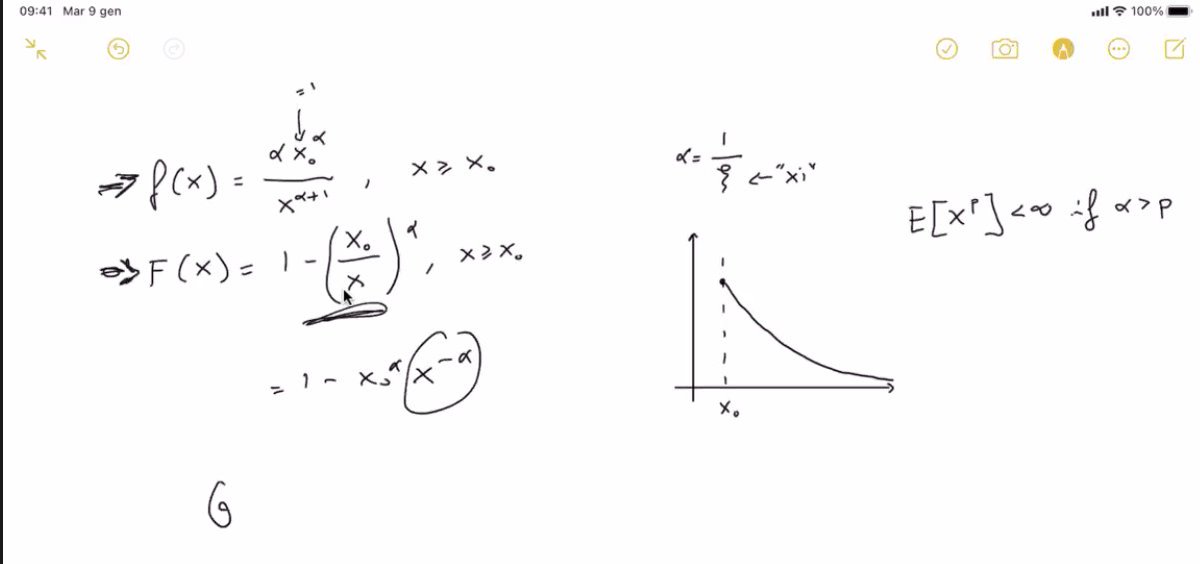
Power laws are more general than fat tails. In order to be fat tailed, one needs a power law component in the tails. Pareto is an entire power law. 9/n
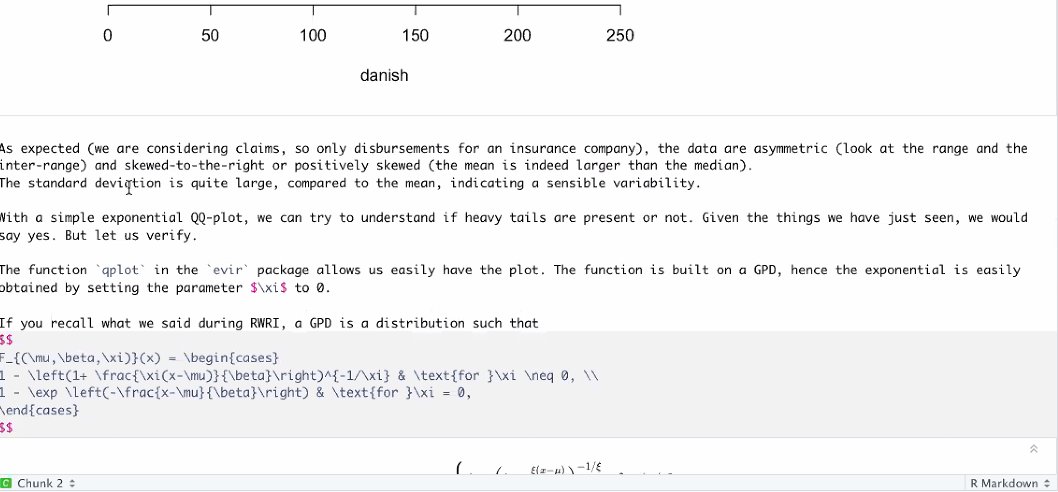
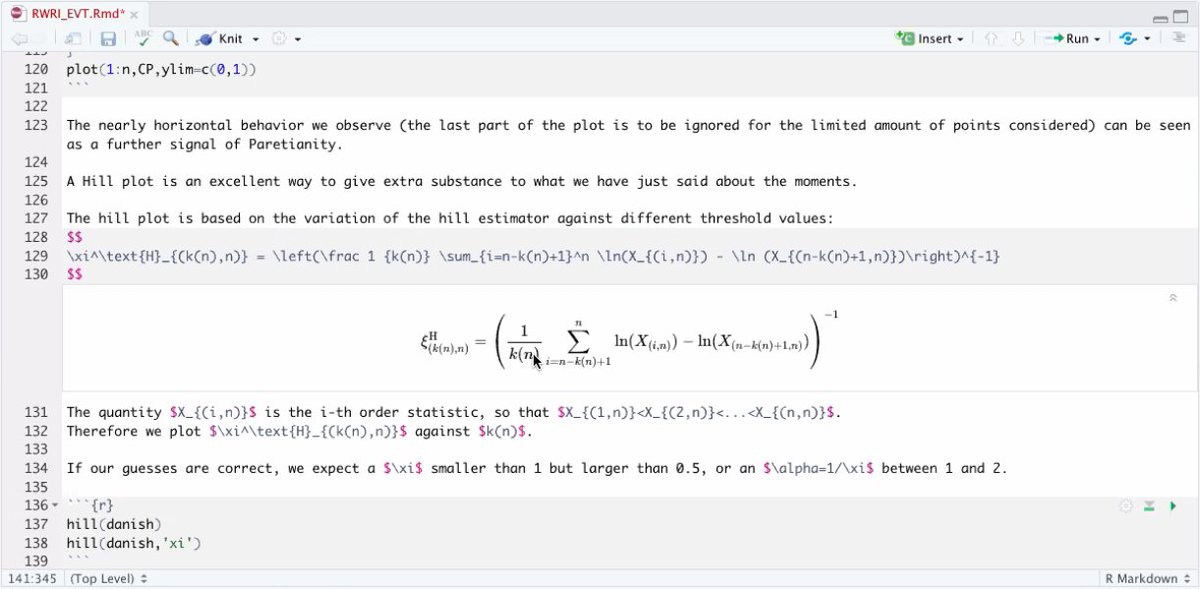
The problem in EVT is finding the thresholds. The highlighted formula corresponds to a GP (Generalized Pareto) formulation. 10/n
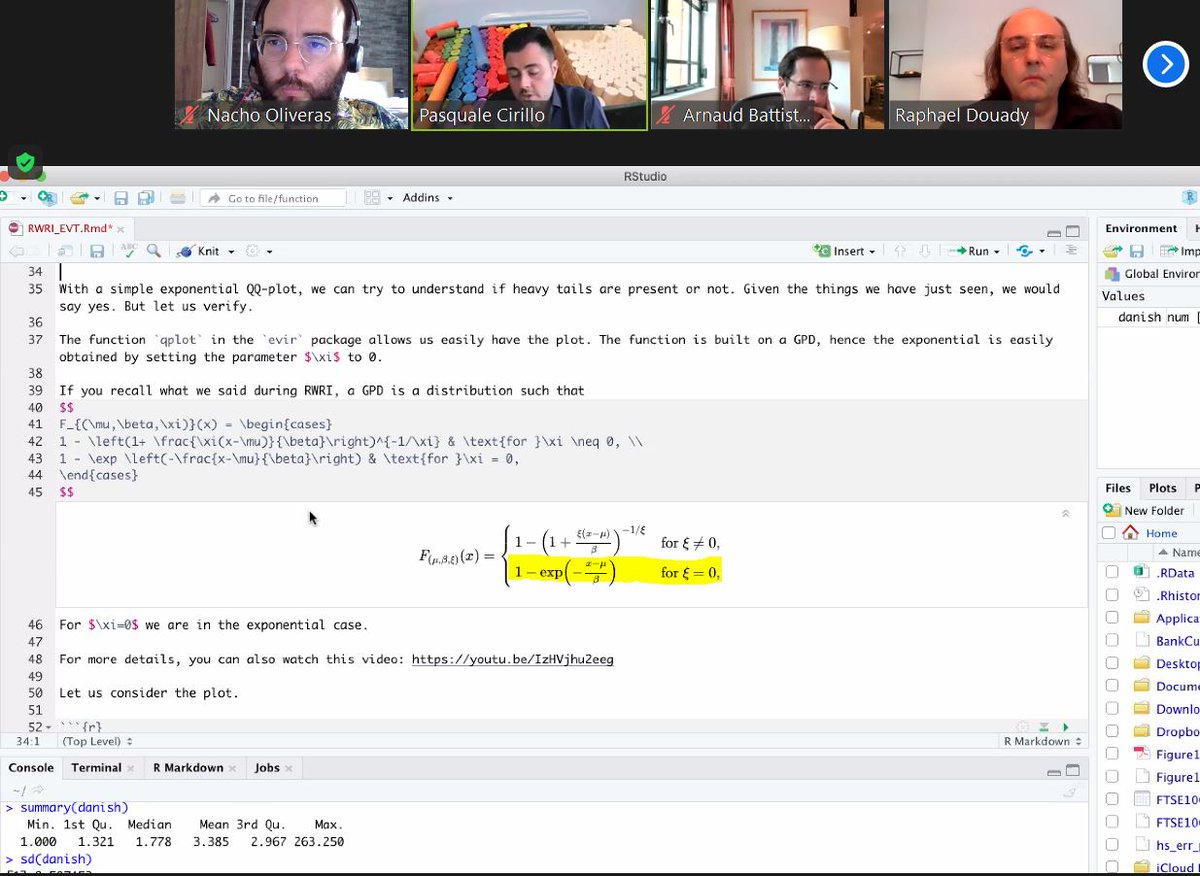
The first thing is understanding is our distribution is heavy-tailed. If it is, it may be fat-tailed. If it isn't, it is thin-tailed and then we will look at the moments. In EVT we don't care about normal as much as by exponentials. Let us qplot the data... 11/n
The qplot plots data in quintiles (up to ~263). If data was coming from a standard exponential it would lay over the diagonal line. It doesn't, we see concavity, this is a clear signal of heavy tails. Convexity is, conversely, a signal of thinner tails than an exponential. 12/n
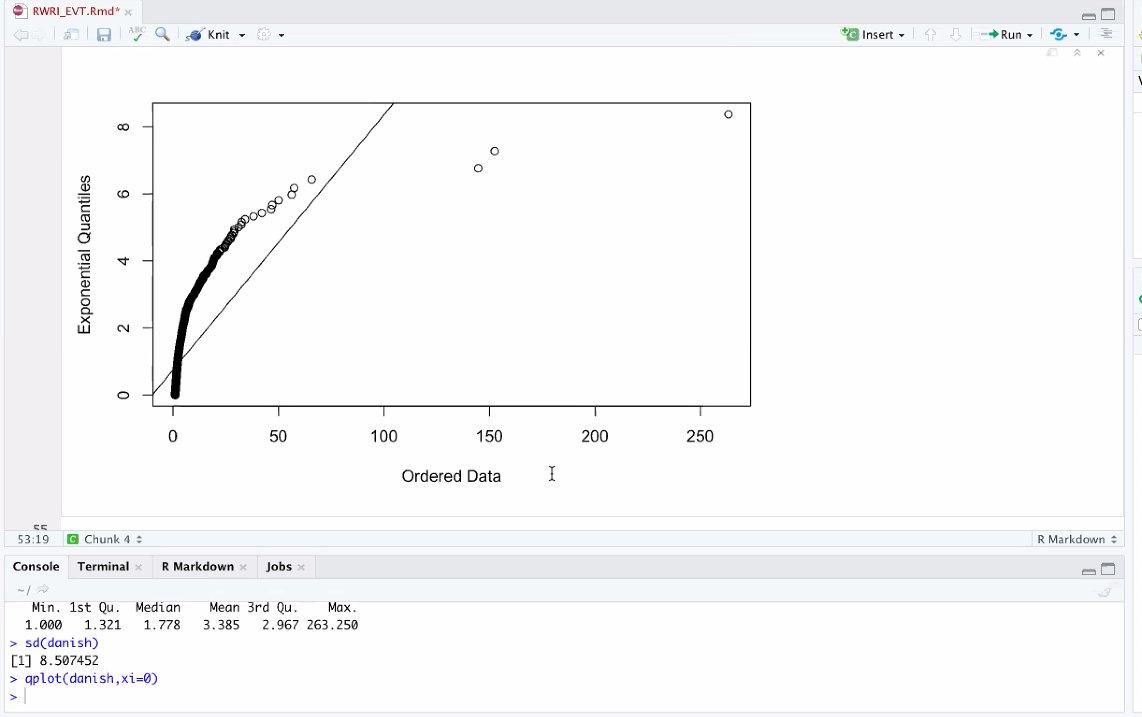
Edit *Quantiles* A reminder Heavy means it decays slower than an exponential, power law tells us how it decays. Same as "I measure less than 1.9m" or "I am 1.8m tall", the second statement is more precise than the first. 13/n
A question: Are exponential function used for what relates with time? @DrCirillo: The exponential functions have many uses, not just with what relates to time, but it is often used to processes related with decay. EVT is not a new theory, it was developed ~100 years ago. 14/n
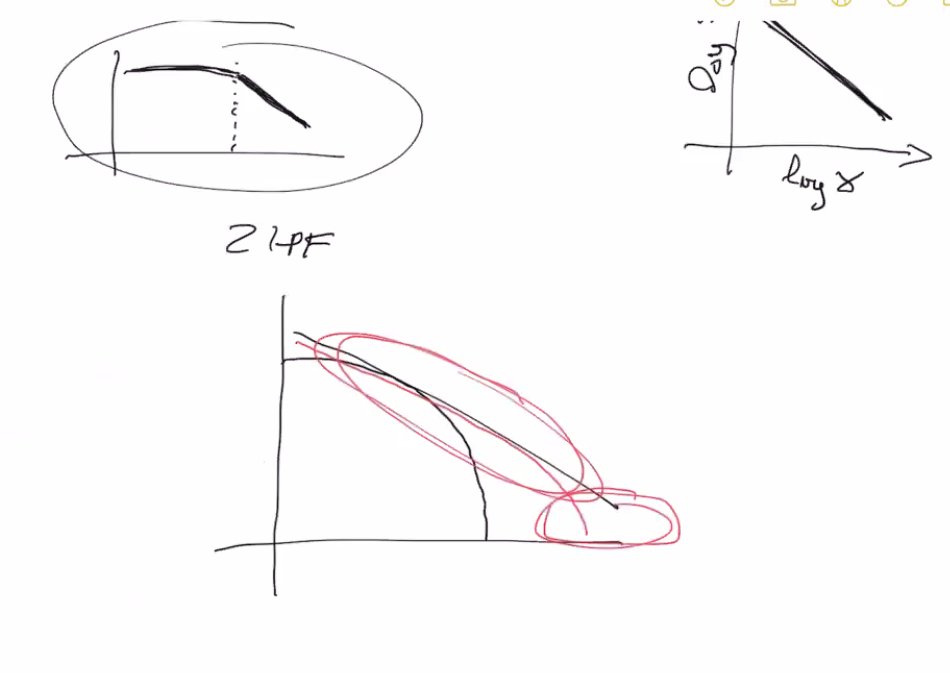
We often waste time by assuming normality. Dr Cirillo says he might have bias, but that "Pareto should be the new normal", as most things are not normal. Let us use a Zipf plot (from Zipf, the scholar who studied the distribution of words in the English language)... 15/n
Zipf maps Paretian for a large part, but not the whole data. @DrCirillo tells us to be careful of plots, but if we won't observe any linearity at all in the data over the plot, this is a first signal of fat tails (concavity, or some concavity will rule out fat tails). 16/n
Fat tails is a term used very often (marketing, medicine), and often not precisely, but this does not mean that it does not have a precise technical definition. From J Bold, a reminder. 17/n
"Fat is heavy, but heavy is not necessarily fat. Heavy decays slower than exponential but this doesn’t confirm power law. Fat tails decay via power law". 18/n
When we talk about moments and infinite moments not having mean or variance, this does not mean that we cannot measure the mean or the variance of a sample, which can always be done, but that those values might be meaningless in certain circumstances. For example? 19/n
Our average wealth if we invite Bezos into the room, or if we not. I ask @DrCirillo how he translates fat tails and heavy tails into Italian, he does so by "coda grassa" and "coda pesante". 20/n
I was slightly interrupted, unfortunately First plot is data, plot 2 is data squared and p = 3 the cube, etc. We observe the moments, and see if by the law of large numbers it closes to 0. Here the moment does not exist (we don't have convergence) certainly for the cube. 21/n

Nor p = 4. Convergence for the square is even questionable. Depending on the speed of the convergence , the fatness of the tail. We can apply this formula, if parameter kappa pointed by Pasquale C. is larger than 10 possibly we do not need EVT. 22/n
What is the alpha of our sample? ~1.5? The red lines are the 95% confidence intervals. We don't care if it is 1.47 or 1.49: @DrCirillo recommends to stop at the first decimal: that is informative enough and we have to assume some error anyways. 23/n
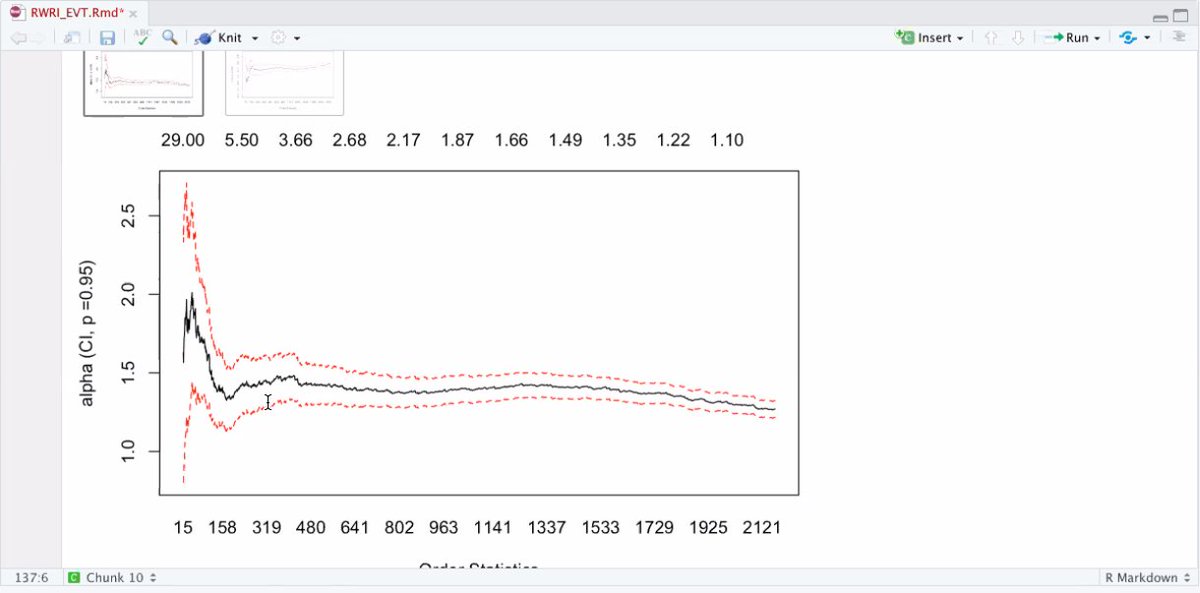
Question about the axis. In that graph y is alpha, on the x axis we have the observations ranked by size. 24/n
If alpha is negative, we can have something that behaves like a power law, but it isn't because it has an upper bound. The Hill plot we saw yesterday makes only sense if alpha is positive. 25/n
If our alpha was, on the other hand, something like 300, it would not make sense to talk of fat tails, and we would be with all certainty in the thin-tailed domain. 26/n
Recaps of the plots. The plot with the hand on it is plotting the errors, that are normally distributed as an exponential around one, the last plot shows the stability of the queue in the quantiles (it holds as a power law). 27/n

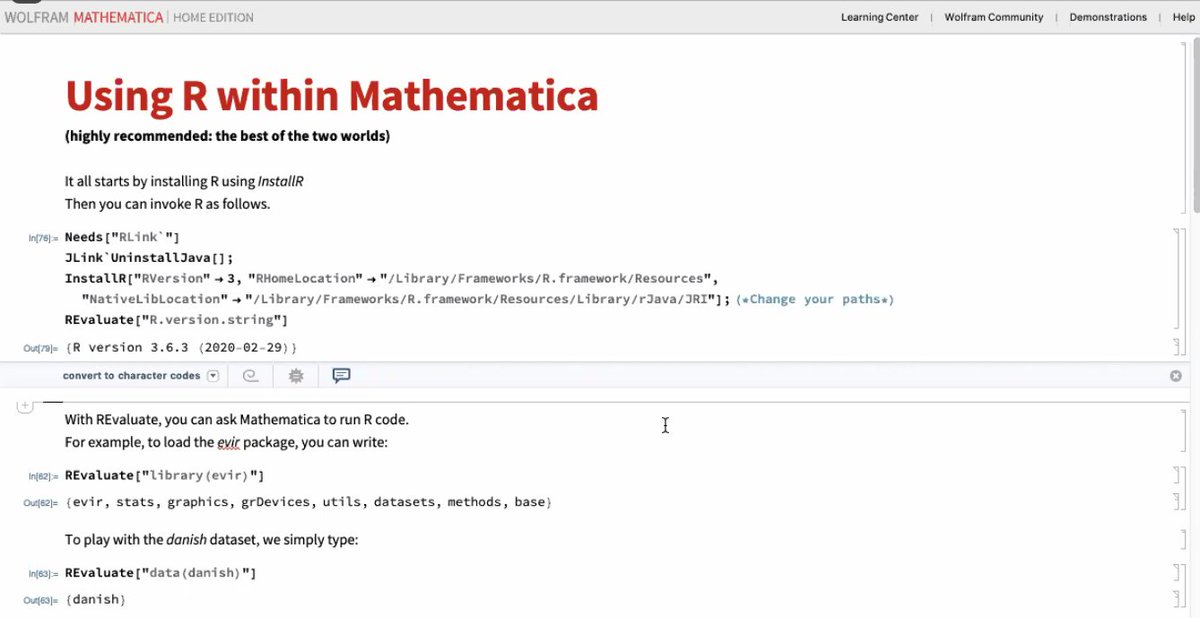
Software? R, Mathematica, Python? Each software has its own advantages. This is like discussing if vanilla or chocolate ice cream is better. @DrCirillo prefers Mathematica is better for symbolic analysis and plots, R for academic purposes, etc. 28/n
A question by @NonMeek: do risk managers in banks like EVT? Answer: Not so much, but the problem is not the risk analysts, that are aware of these things, as CEOs or regulators. Those would only be interested in meeting the regulations. Some attendant had a comment... 29/n
Capital requirements increase under EVT. @DrCirillo says true, but not necessarily dramatically (depends on your modelization), this is more linked to regulation. Everyone seems to agree, including Raphël, that at the end, it all comes to politics and stubborn regulators. 30/n
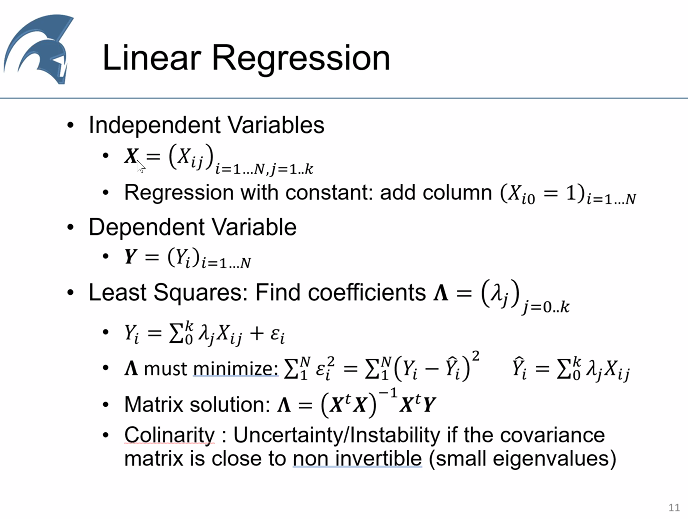
It was an excellent session. We are back with Raphaël now. What is a linear regression? Check the independent variables and check the relation, i for time/size, k the factors... 31/n