
Today is the grande Finale of #RWRIPPP1 with Raphaël Douady. Sound seems very good and Raphaël in top shape, citing Minsky, Franco his Modigliani, and saying that the Chicago school of economics might have many Nobel prizes but their models are shit. A promising appetizer. 1/n
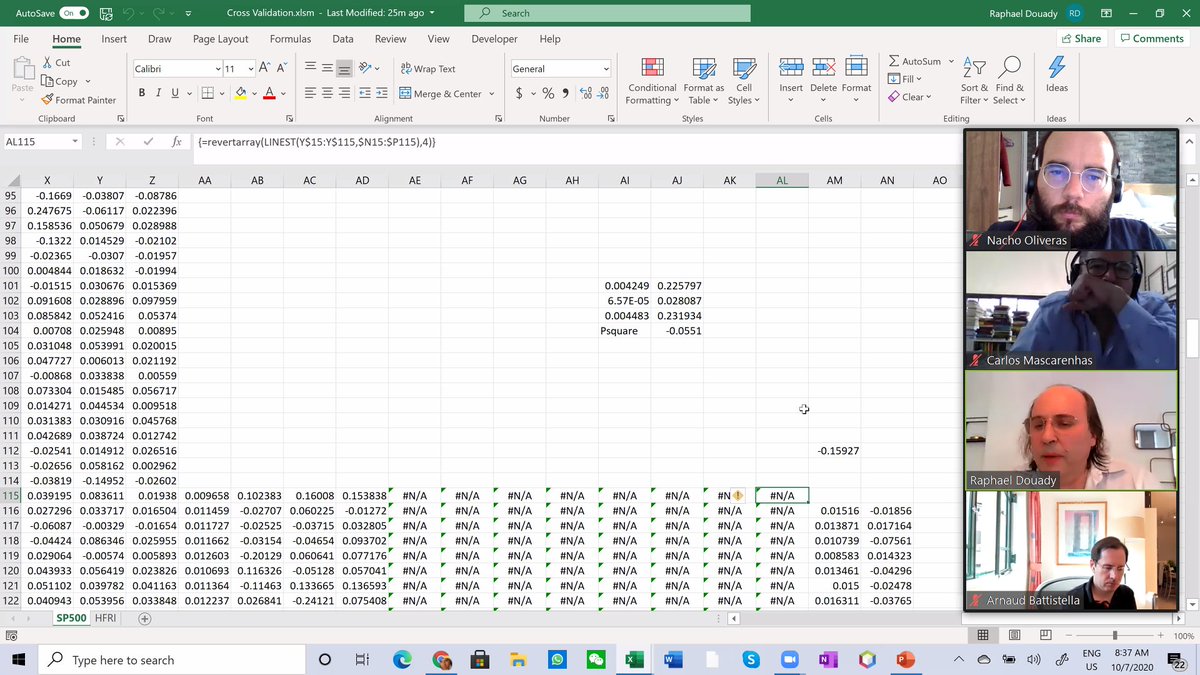
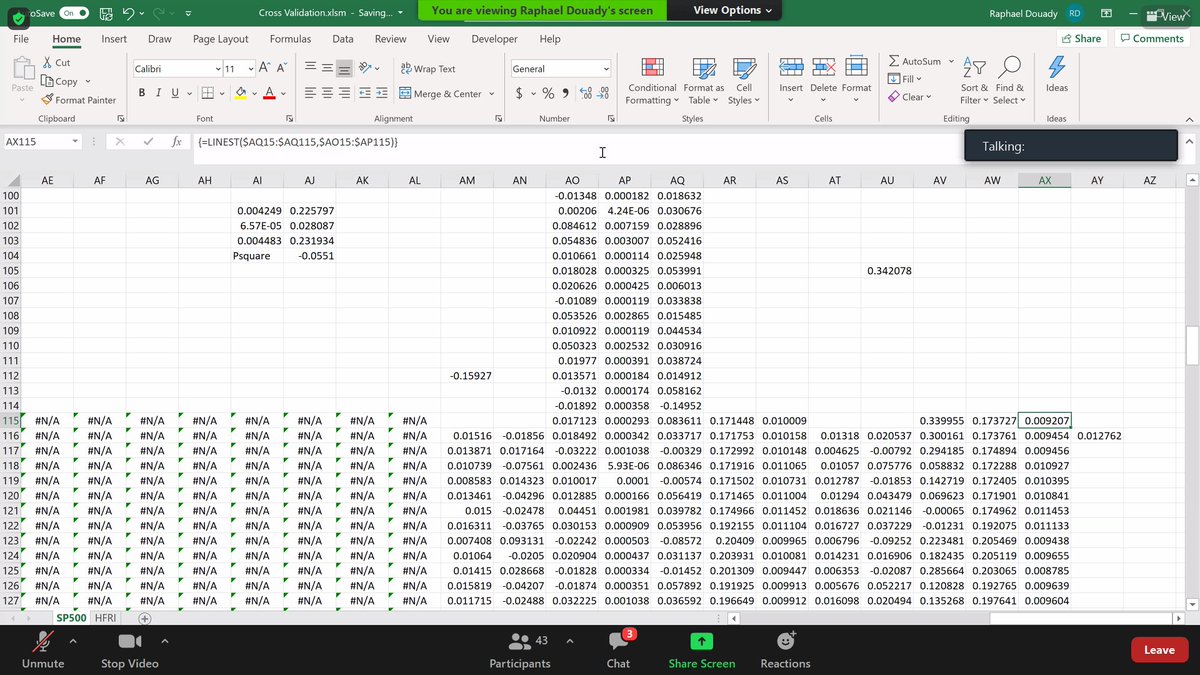
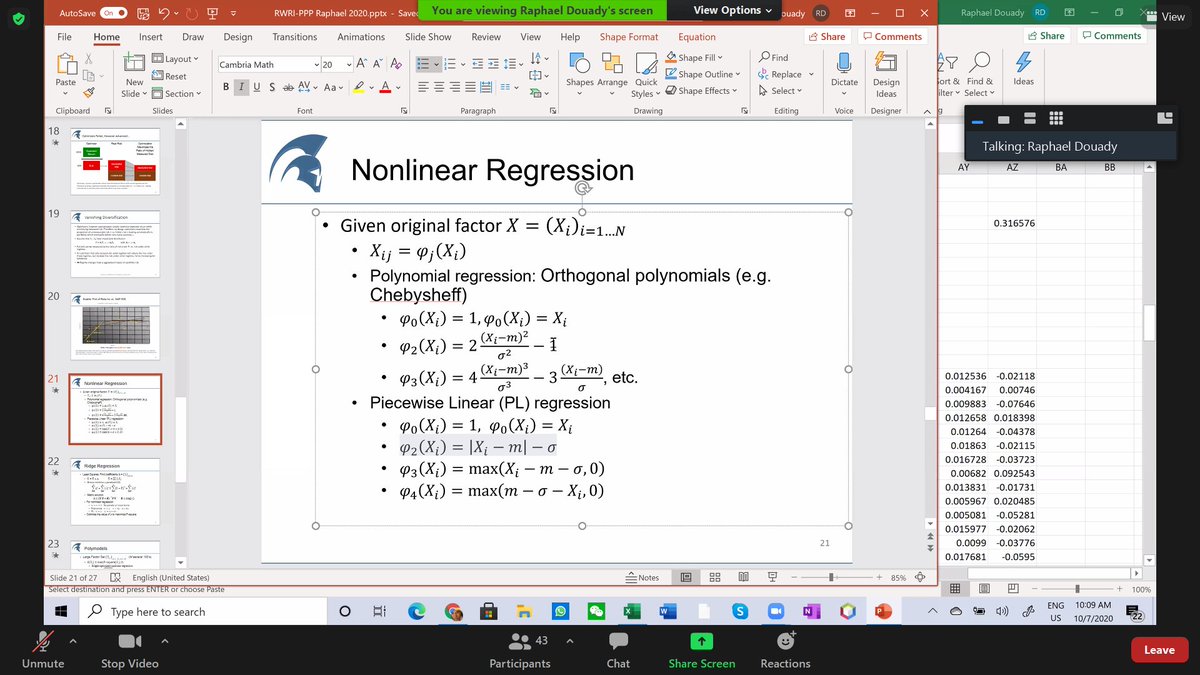
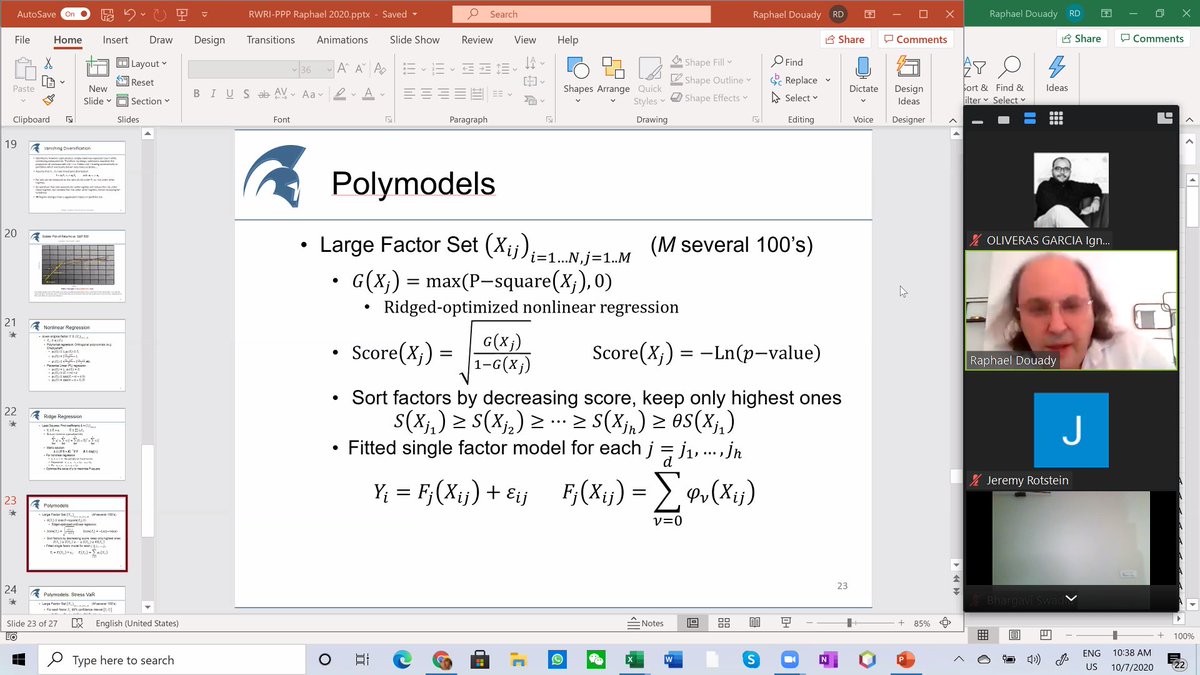
I missed the moment, but Raphaël has like 100 internet tabs open. And he rebooted his laptop yesterday. We recover the spreadsheet he was using yesterday. What is a polynomial? It is just adding one regressor, on top of having kappa and beta times x we add x squared. 2/n
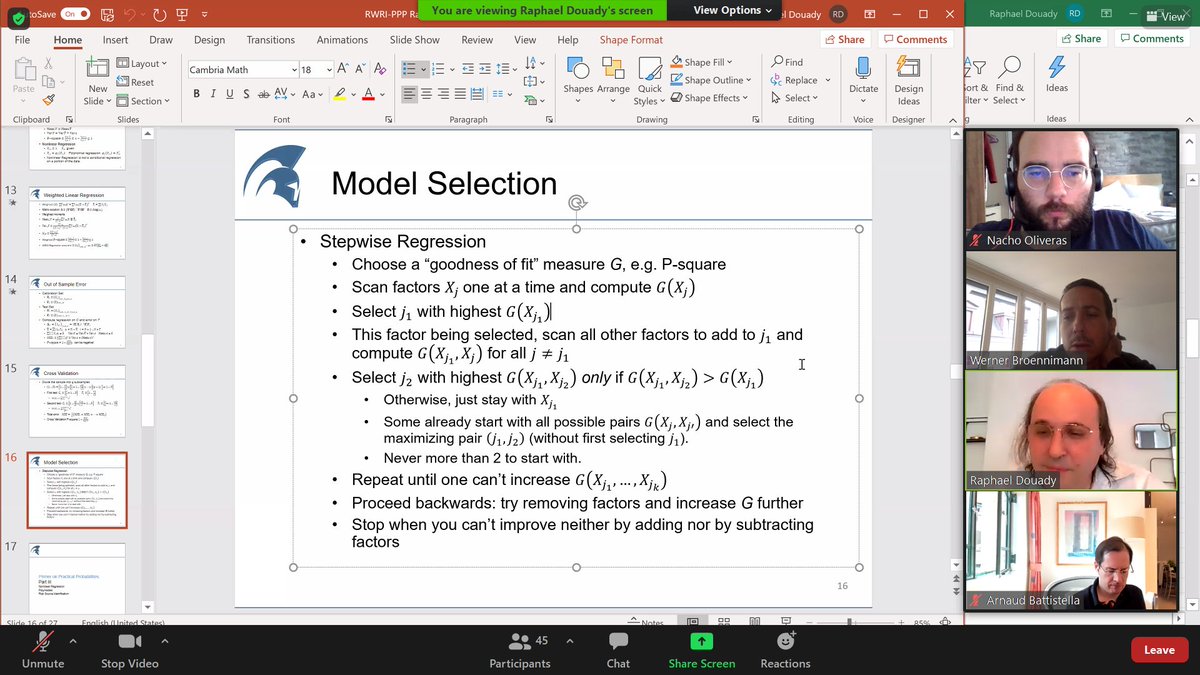
Raphaël explaining how to tinker with factors to improve P-square, Werner asking if we can get stuck in a local maximum. Absoutely! Says Raphaël. The whole industry is about picking the right risk factors. 3/n
Raphaël tells us that he was reluctant to use cross validation at the begging for being too restrictive/severe, but then he learnt to use P-square as test. P-values works, but P-square is the most useful (or more difficult to fool than others). But there is no panacea... 4/n
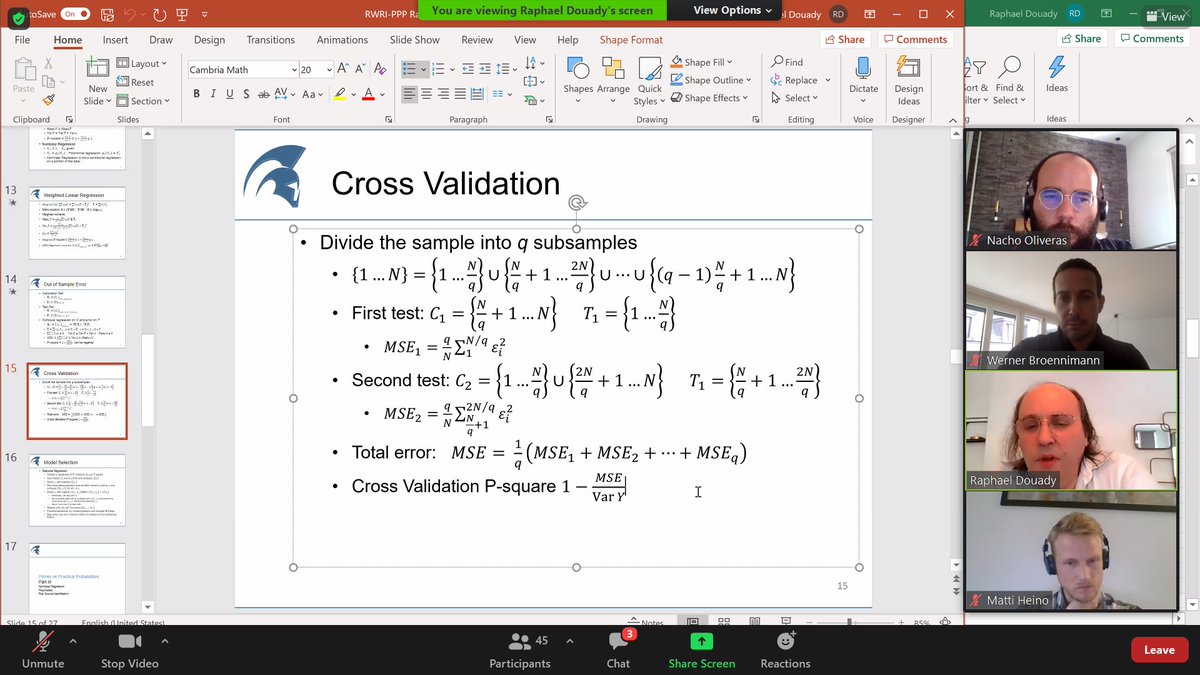
Today, there are even companies specialized in cross validation. It is complicated to test factors. It needs to be done in different time periods, forms, etc. But eventually one gets a good factor set. People do often calculations without thinking what they are doing. 5/n
A good doctor will not ask to do a massive battery of tests, he will ask questions, get to understand the issue, then maybe say you need to take a test for allergen X and then order you just that test. Someone suggests to try as many factors as possible, Raphaël disagrees. 6/n
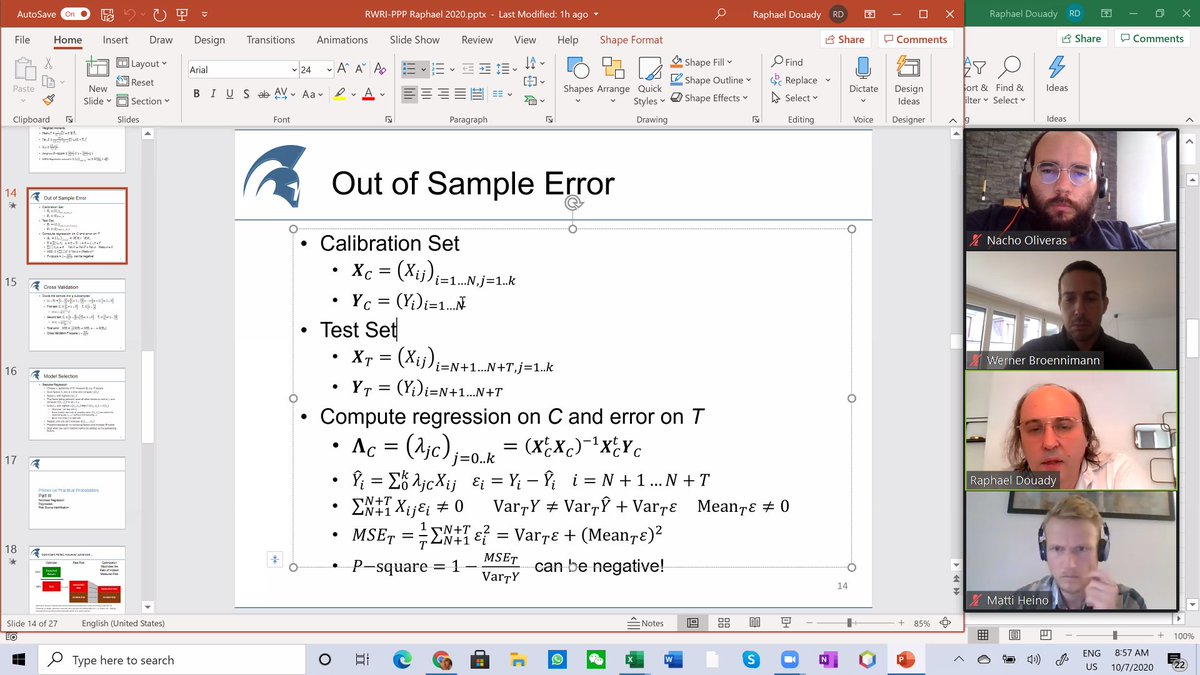
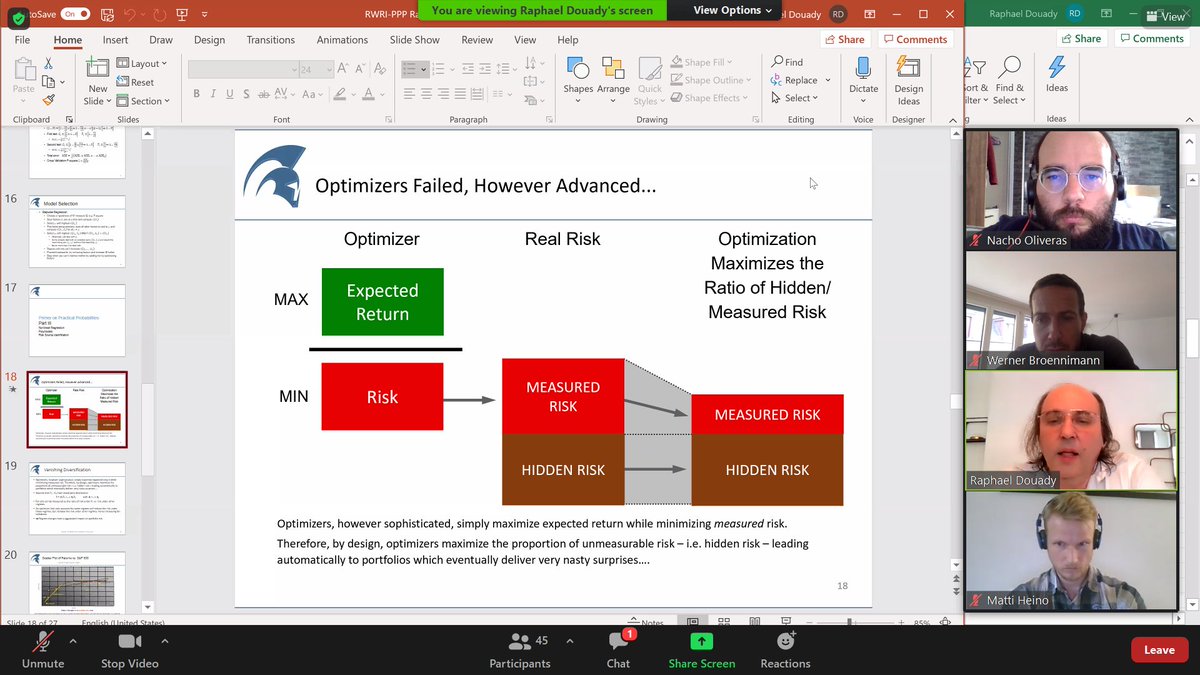
We get eventually started with a RWRI slide NNT likes a lot. Slide says that when we minimize risk (e.g. via diversification), but the measured risk is based on past data, so contains a lot of hidden risk. But objective was decreasing risk, not just measured risk... 7/n

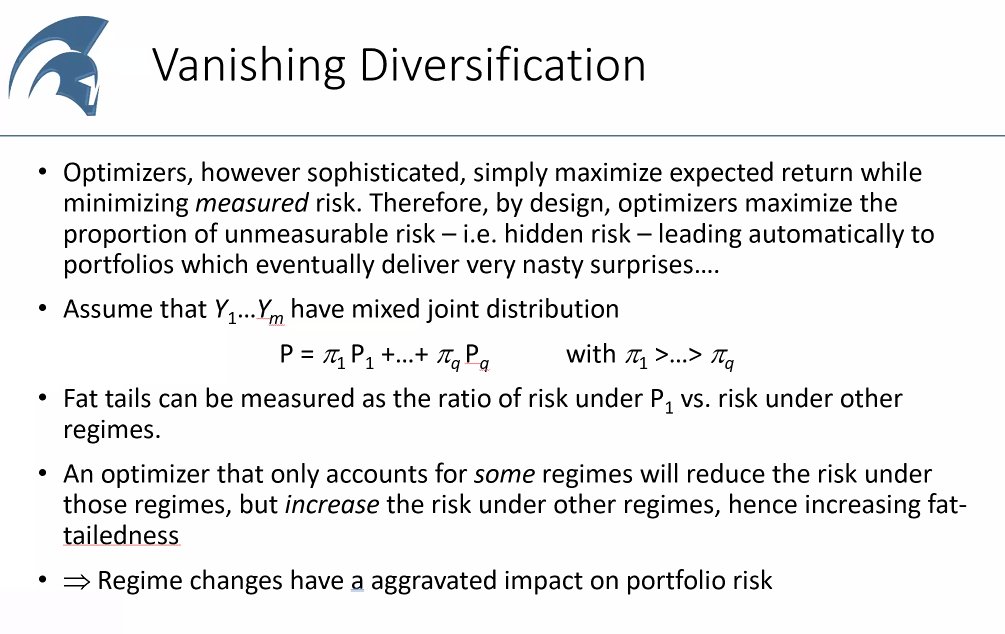
Someone asks if all this models are not Gaussian. Raphaël partly agrees. There is an underlying assumption of fat tails. Raphaël gives an example, a football (rugby) ball, it is elliptical. I did not copy this, sound issue. Also a potato germing, with ramifications... 8/n
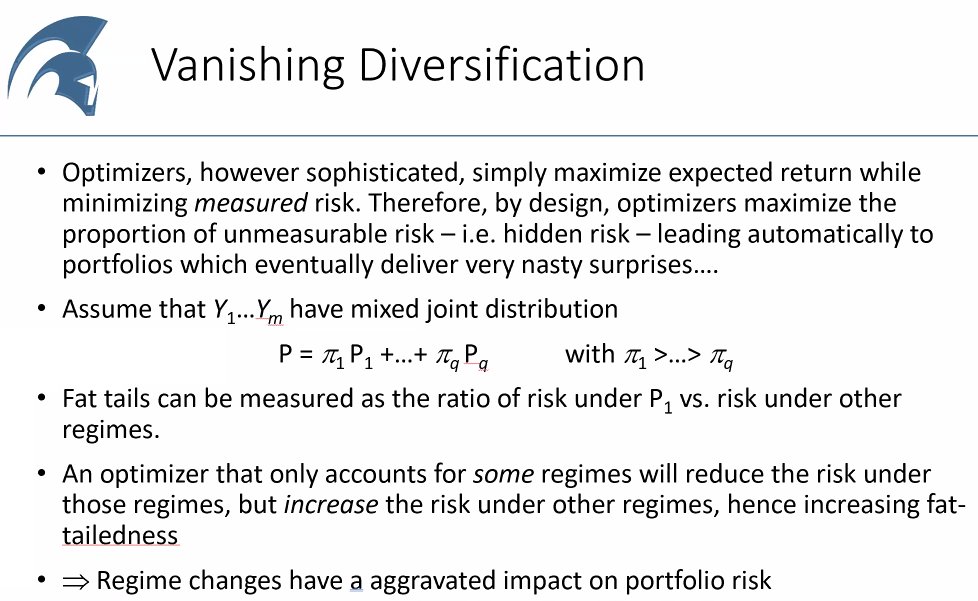


Some risk factors, in the extremes, hide huge risk factors, this was the case 2007 and 2008 with mortgages. Covid is one such factor, that could make blow up entire portfolios. This is the real question of the "curse of dimensionality" I wrongly mentioned yesterday. 9/n
Via @NonMeek :-p 10/n

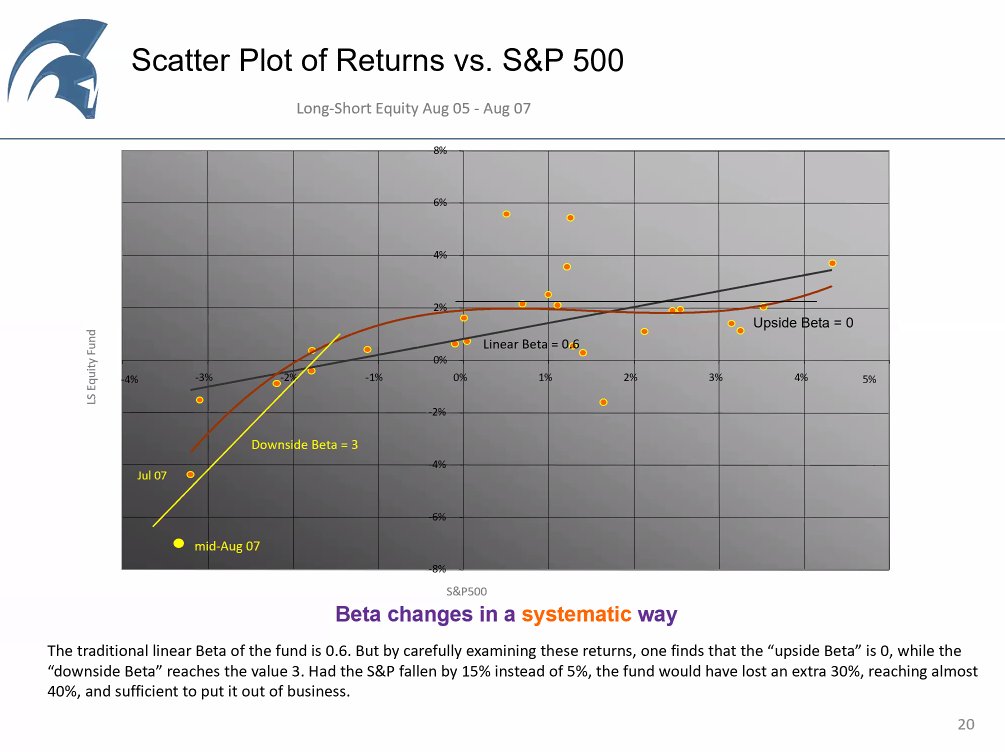
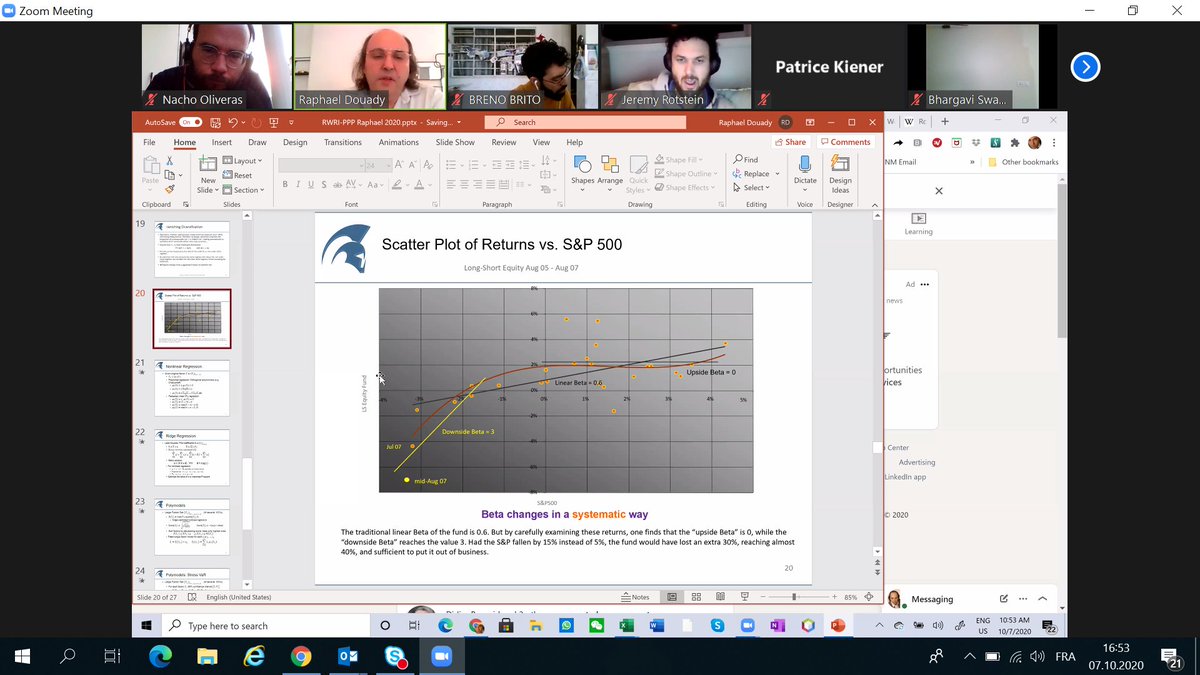
Dynamics: things build up. We know a move was 4%. After the fact, we know the probabilities of the regime: it is more likely this maps a large regime change than a 4x "normal" 1% change... The are with the yellow line signals a systematic regime change. 11/n
Regression in practice. Yesterday we regressed real estate with SP500 values and ETF, high covariance. If I make linear changes to my regressions, we will get the same results as yesterday. But what if we use polynomial regression? 12/n
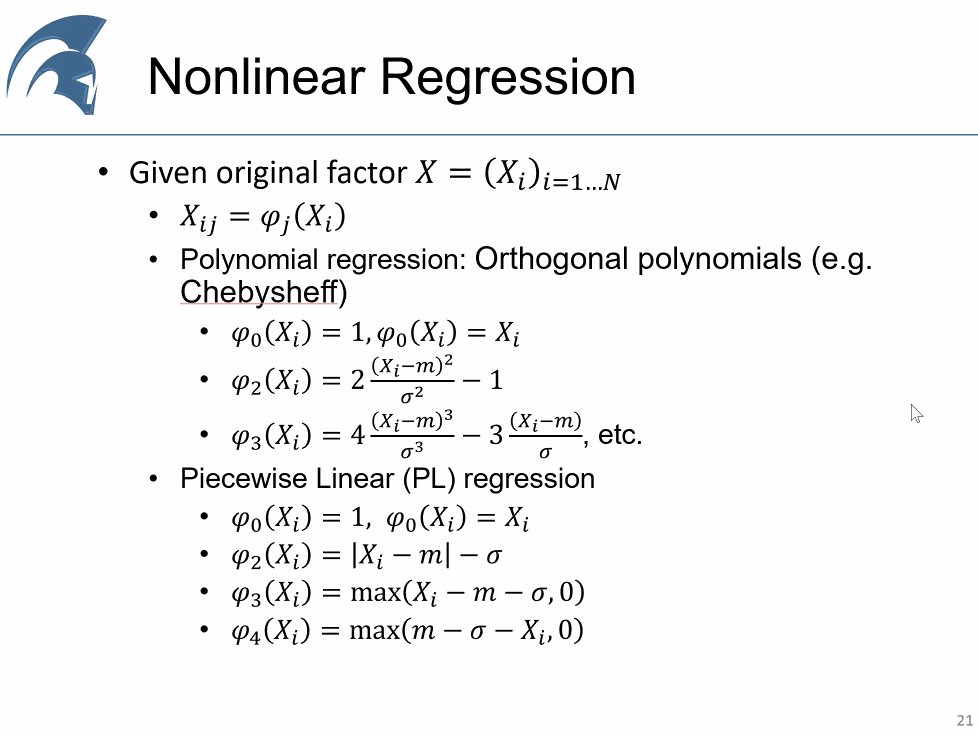

Raphaël squares one regressor. 13/n

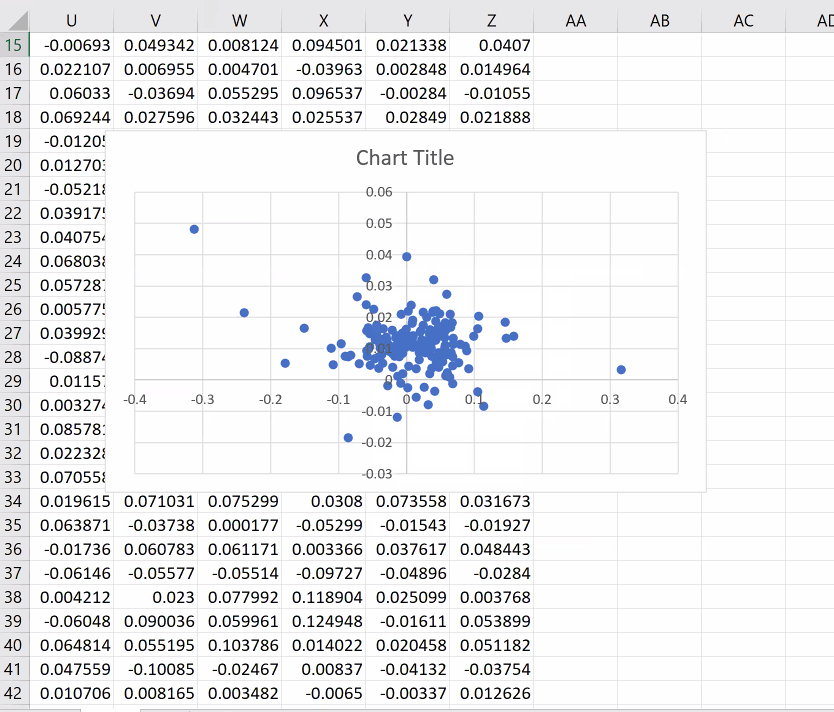
Reminder: the big jump maps the 2008 crisis, the real estate market is backtracked 100 months that is ~8 years... 14/n
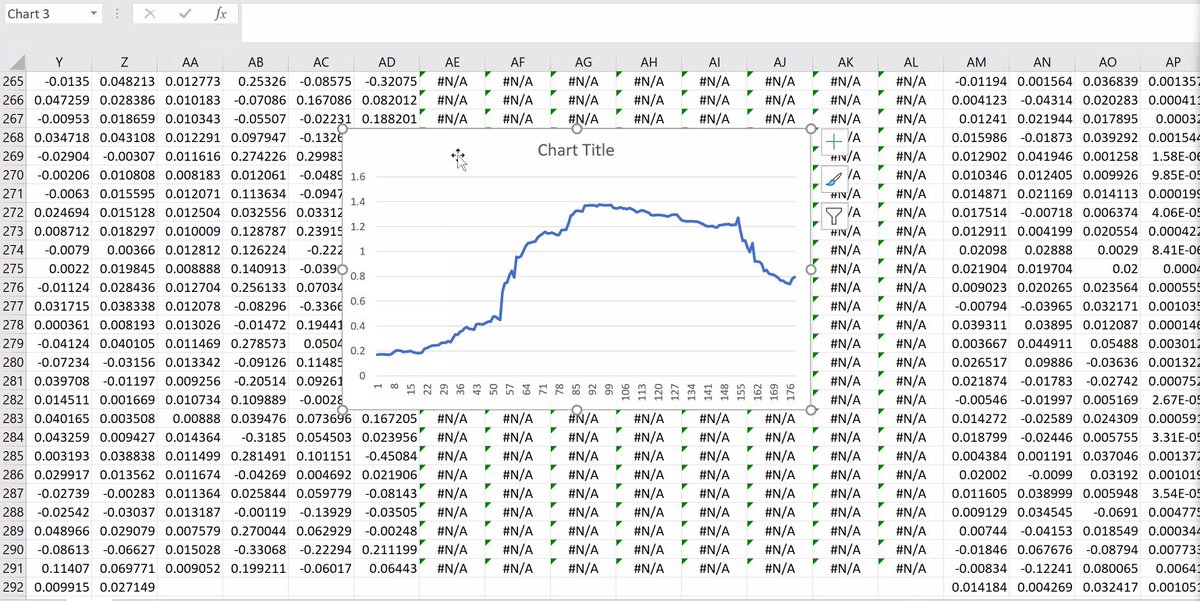
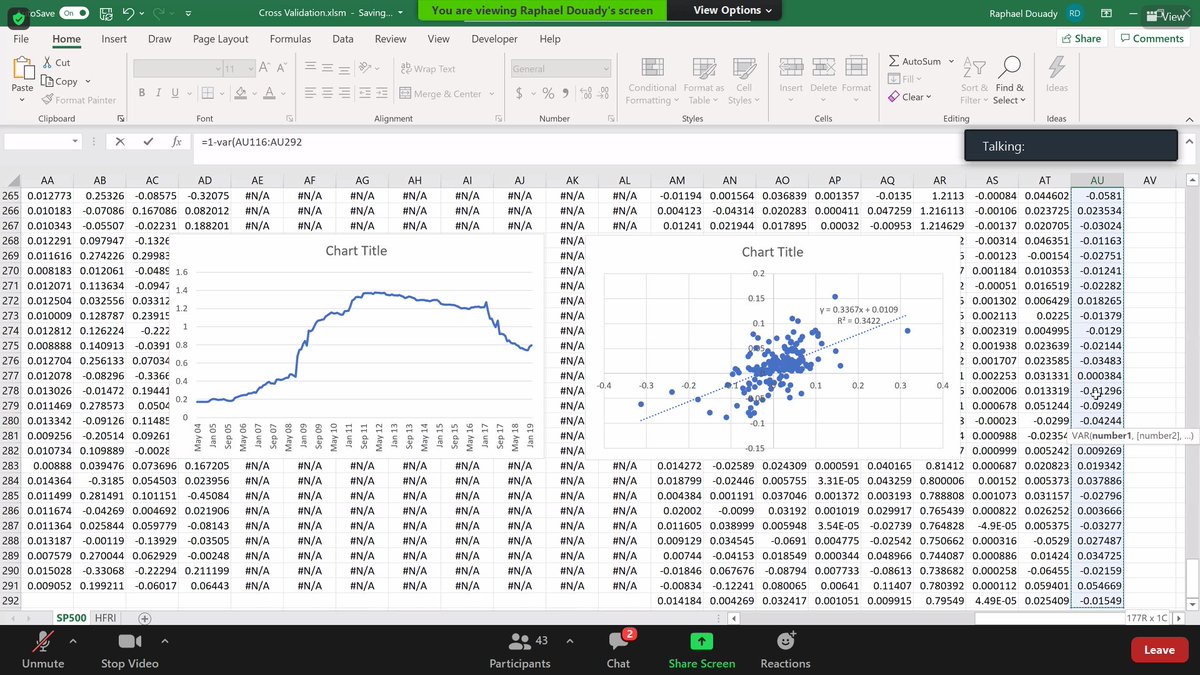
We improve a lot squaring one regressor: P-square is up to 34%. Question: what is a good enough P-square? 34% is a pretty good P-square (not bad, that is French for good). 15/n

It depends on the number of factors. 0.2 with 500 factors might be good, with very few factors something below 0.5 might be bad. 16/n
This what is plotted here is non linear regression. The advantage of this technique is identifying changes in the regime. We are in the variable space. Different to non-linear optimization (parameters). Not the "true" behavior is the brown line (when it drops, it drops). 17/n

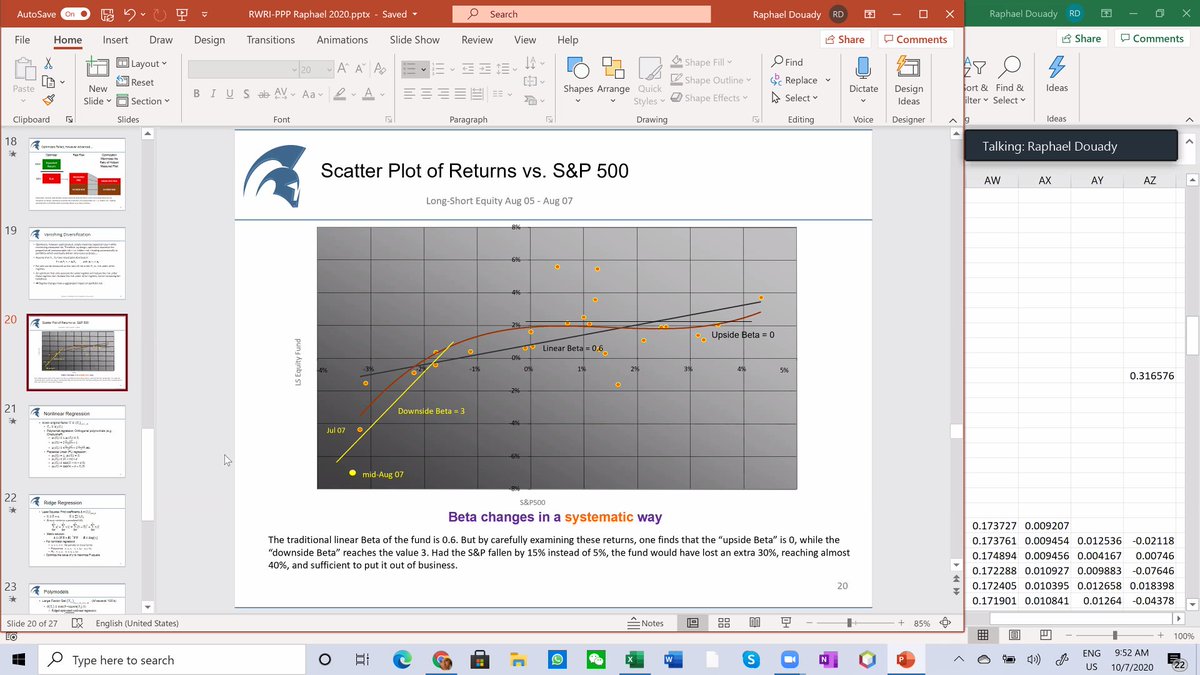
Raphaël tells that for phi 2 he uses the median, not the average, and this is a point of discrepancy between him and NNT. Someone suggests a coffee break (blessed him), Rapaël says 5 more minutes. Result of using linear/non linear reg, and penalizing non-linear regressors. 18/n

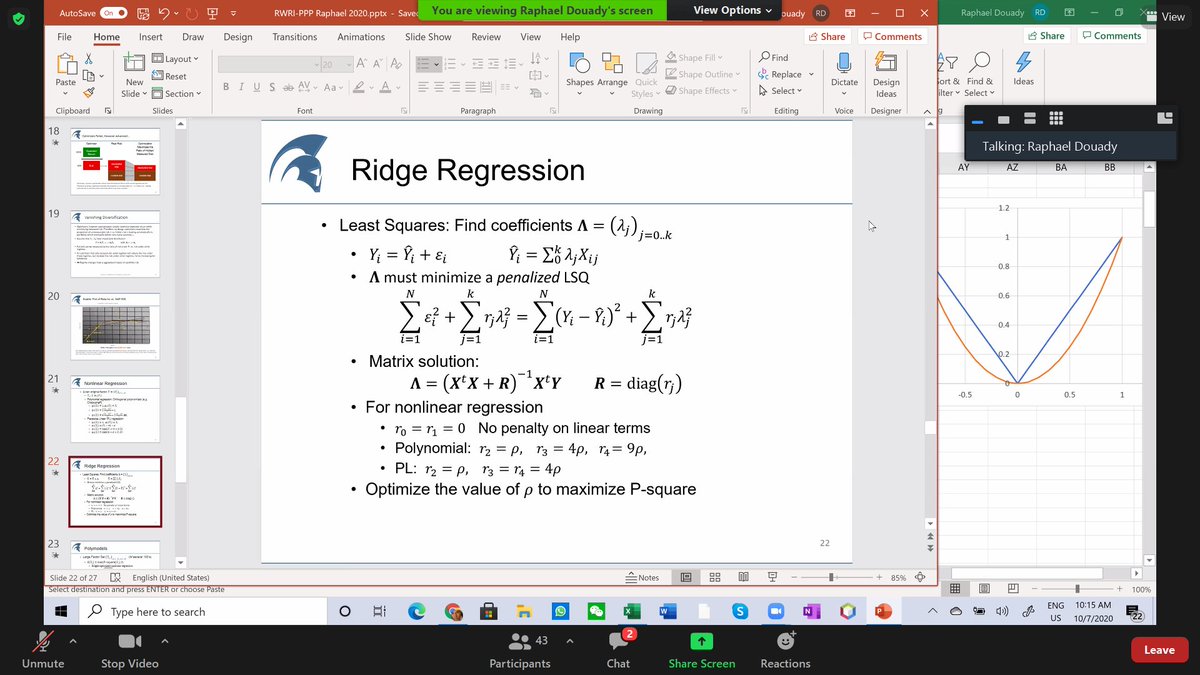
This is to compensate the risk of overfitting. If rho is very low, we will have pure linear regression, the higher the regression the more we penalize. Thomas Barrau, one of Raphaël's students in the attendant, has a whole chapter of his PhD thesis to selecting the rho... 19/n
Neighbor giving me bouzouki concert as I prepare to reconnect... 20/n
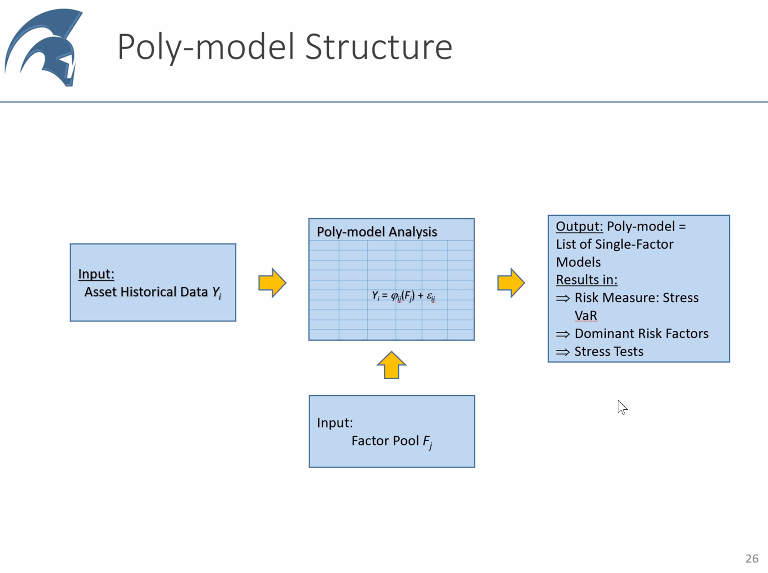
Polymodels now. "I never make a statistical calculation if he does not know what he is looking for." Now he want to see what happens to the portfolio in case of certain events/scenarios happen, or whether to invest or not in a fund. Every scenario is determined by shifts 21/n
in the risk factors. We want to identify risks that can hit that we did not identify. NNT thinks we cannot get hit by risk, if that is the case, we did not see the risk by definition. Here is where Raphaël slightly disagrees. Sometimes, he tells us, we are a bit blind... 22/n
I won't share the next screen to not put Raphaël in trouble, but he is giving us some interesting examples of factors he has been using recently (equities/bonds/mutual funds in different industries/countries, etc.). 23/n
Observe Raphaëls internet tabs... (PC rebooted yesterday). He just closed Slack as he was getting repeated notifications from a client. 24/n

Score: not good goes to 0. Good, can go to infinity. G is at 1/3, score is 70% G is 20%, score is 50%, etc. (just to give orders of magnitude). The brown line is F (best linear regressor). 25/n

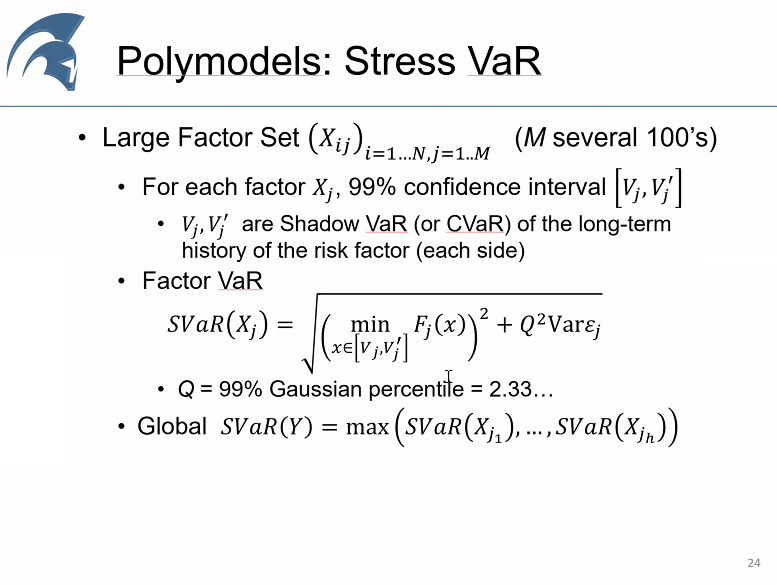
Had to answer some call. Let's remove the factors not having good score (down from 200). We calculate the 99% confidence interval and within that interval the worst case scenario. 2 funds, one progresses linearly, one does much quickly. Is SVaR a detector of antifragility? 26/n

Yes, works as a detector. What is the Long Term Expectation (LTE). We do some averaging with the scores themselves as weights. I am sure I would understand all this better if I was allocating any considerable amounts of money to funds as many attendants are doing. 27/n
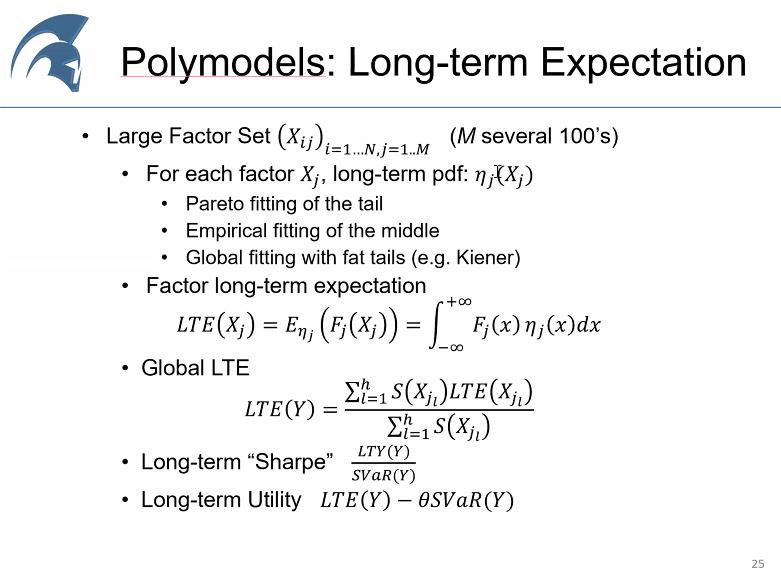
Surprisingly, non linear factors tend to be more stable than non linear ones. Polymodel analysis consists in removing a lot of factors that don't improve the model. 28/n

Many clients show up with simulations, often persuaded they are right. Sometimes they are. Sometimes not. When we apply this polymodels, that is difficult to hide. E.g. I had a client that was trading commodities (in theory) but had a position short on LIBOR... 29/n
Those are correlated, but not correlated enough. They were long gamma in one market, not in other (was not the same gamma). Raphaël was able to identify a hidden risk by using the polymodel. Opens a round of question, before passing to Bayesian statistics if we have time. 30/n