
🧵 Make yours and everybody else's lives slightly less terrible by having all your programs print out their internal stuff as pictures; ✨ a thread ✨
Virtually every program I write can dump its internal state somehow. If there's anything I want you to take away from this thread, it's that you can do this for your own programs. It doesn't need to be complicated!
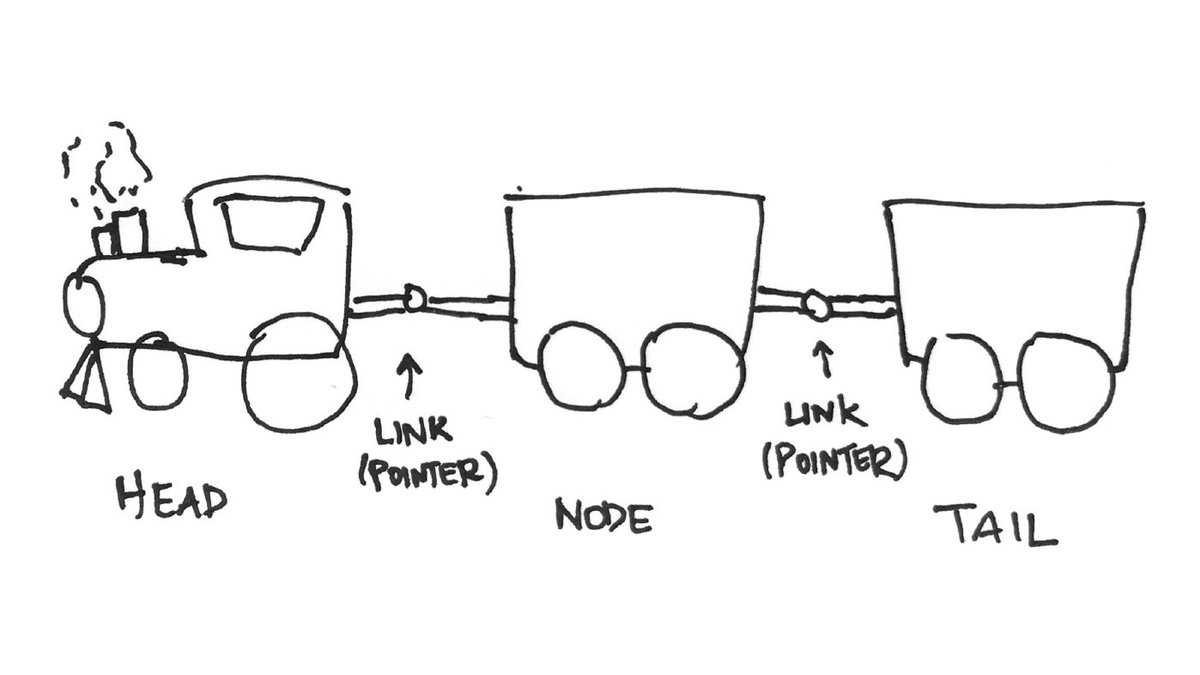
I don't mean like this. You've seen these linked list style diagrams, with pointers as arrows and a little symbol for NULL and so on. These are great when talking about an implementation, but it's rare that you want this outside of studying. Credit: Moses Effiong Ekpenyong
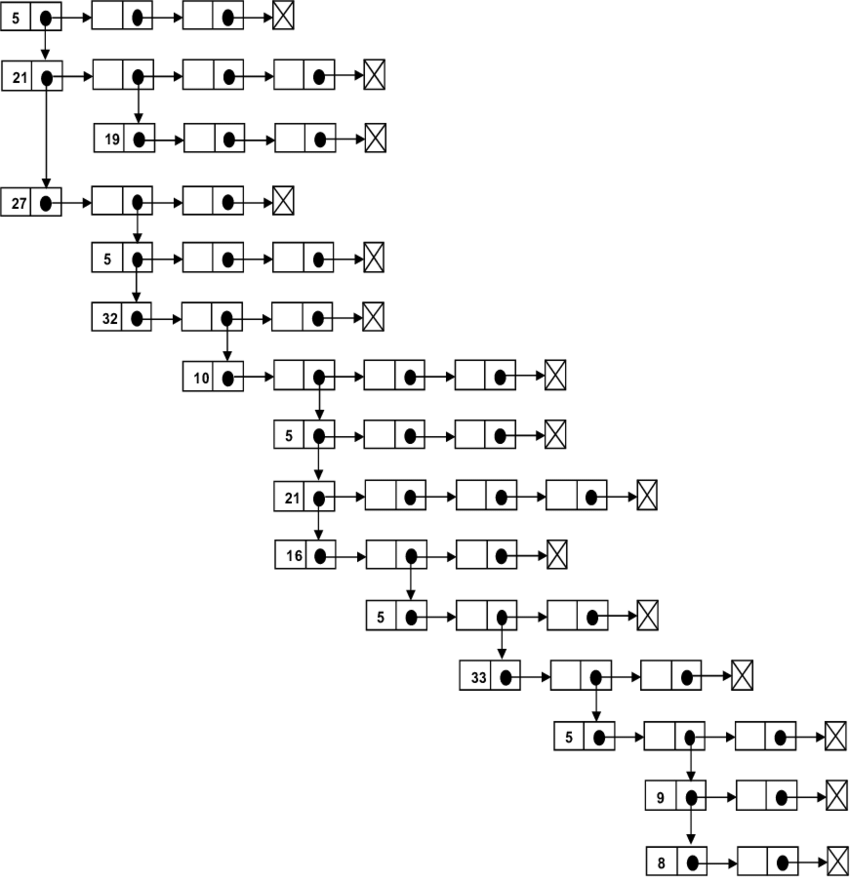
Shout out to Brooklyn College's CISC 3130 for their incredible diagram of a linked list 🚂🚃🚃 source: https://libguides.brooklyn.cun...
Moving up an abstraction layer, is it useful to show an ADT's content? Probably not, no. Better to show something that's more meaningful for your program in its own terms. Sometimes this is the content of a single datastructure, sometimes it's the relationship between a couple.
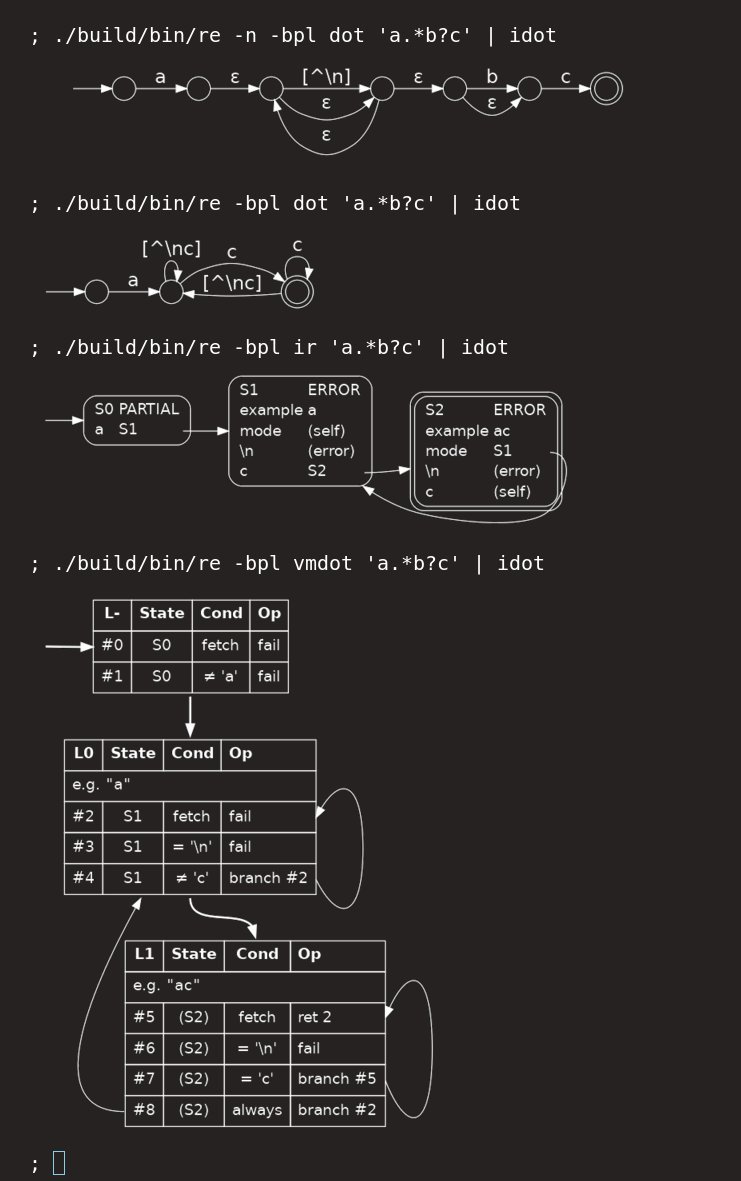
I work on compiler things a bunch, but this idea applies elsewhere too. The reason compilers have phases is *because* there's different data between each phase. So it seems very natural to dump those out. Do this just by adding a flag to your CLI tools! That's all you need.
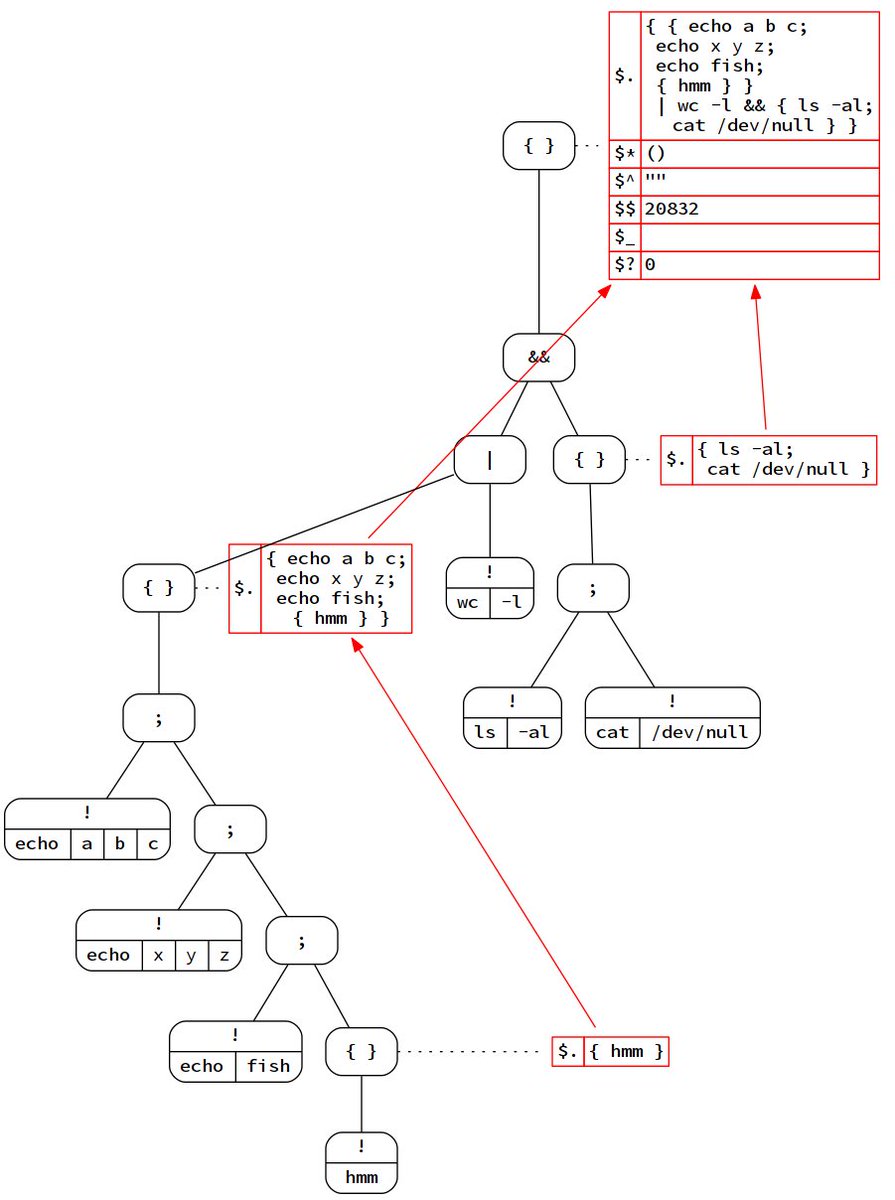
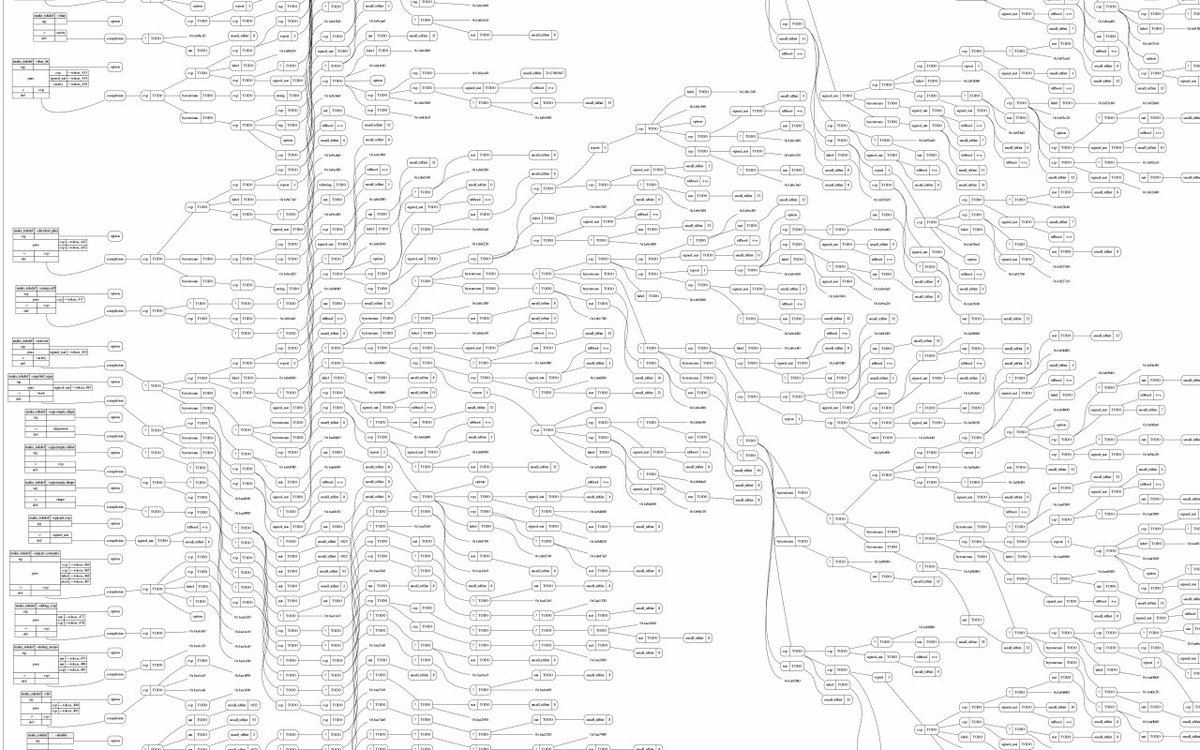
This is a structure from an early phase in a unix shell. My program here is showing the relationship between a syntax tree and a hierarchical symbol table, populated alongside during parse. Hopefully you can see the relationship between them.

See I don't show how they're stored, just what they contain? This is just the content, not about the implementation for these particular data structures. It's the appropriate level of abstraction for debugging other parts of the program.
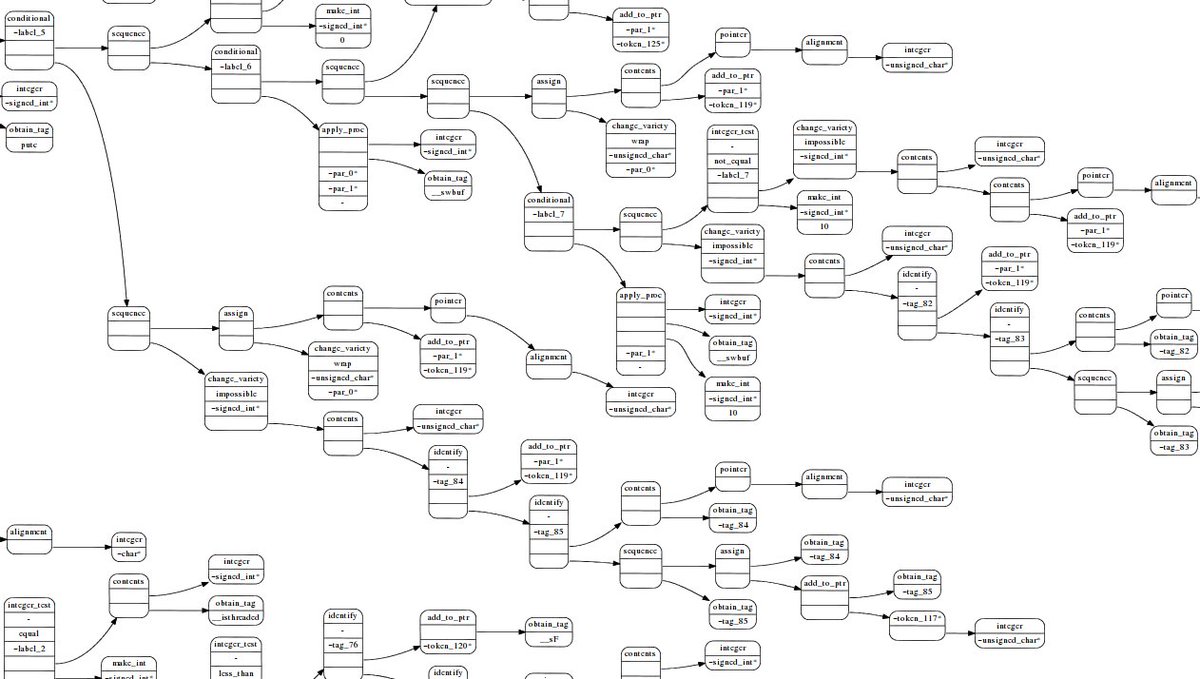
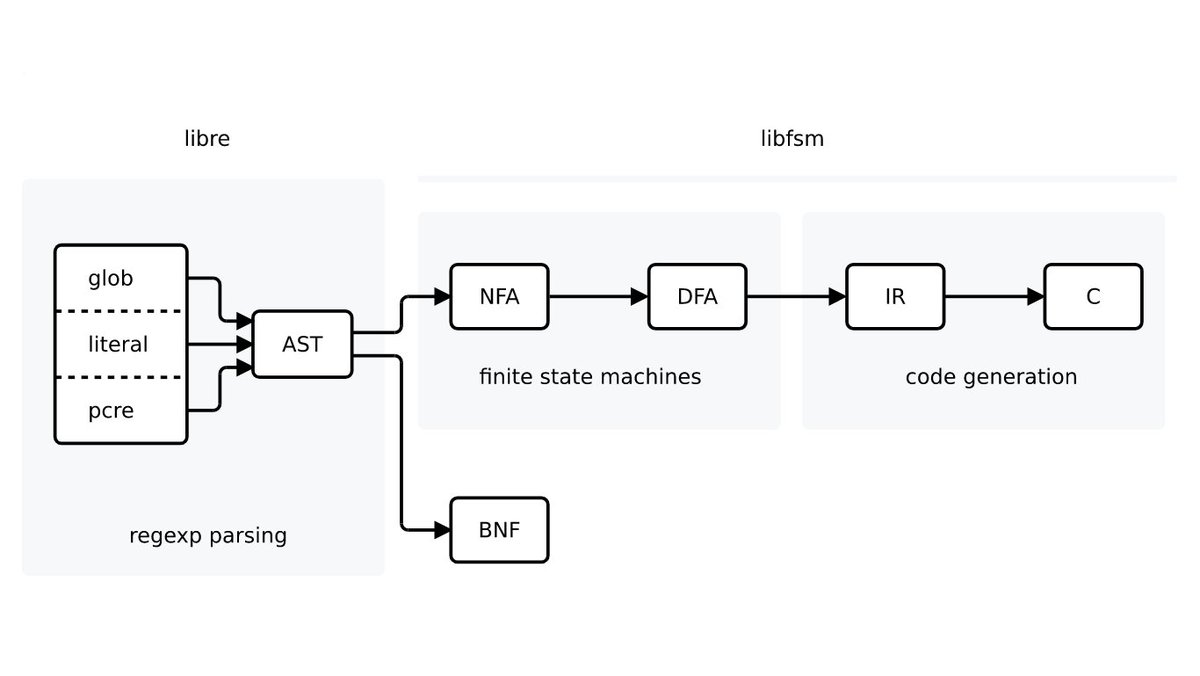
Here's another tree from a different program. This one's an IR from a C and C++ compiler. Unless you're debugging this part itself, the implementation detail is just noise.
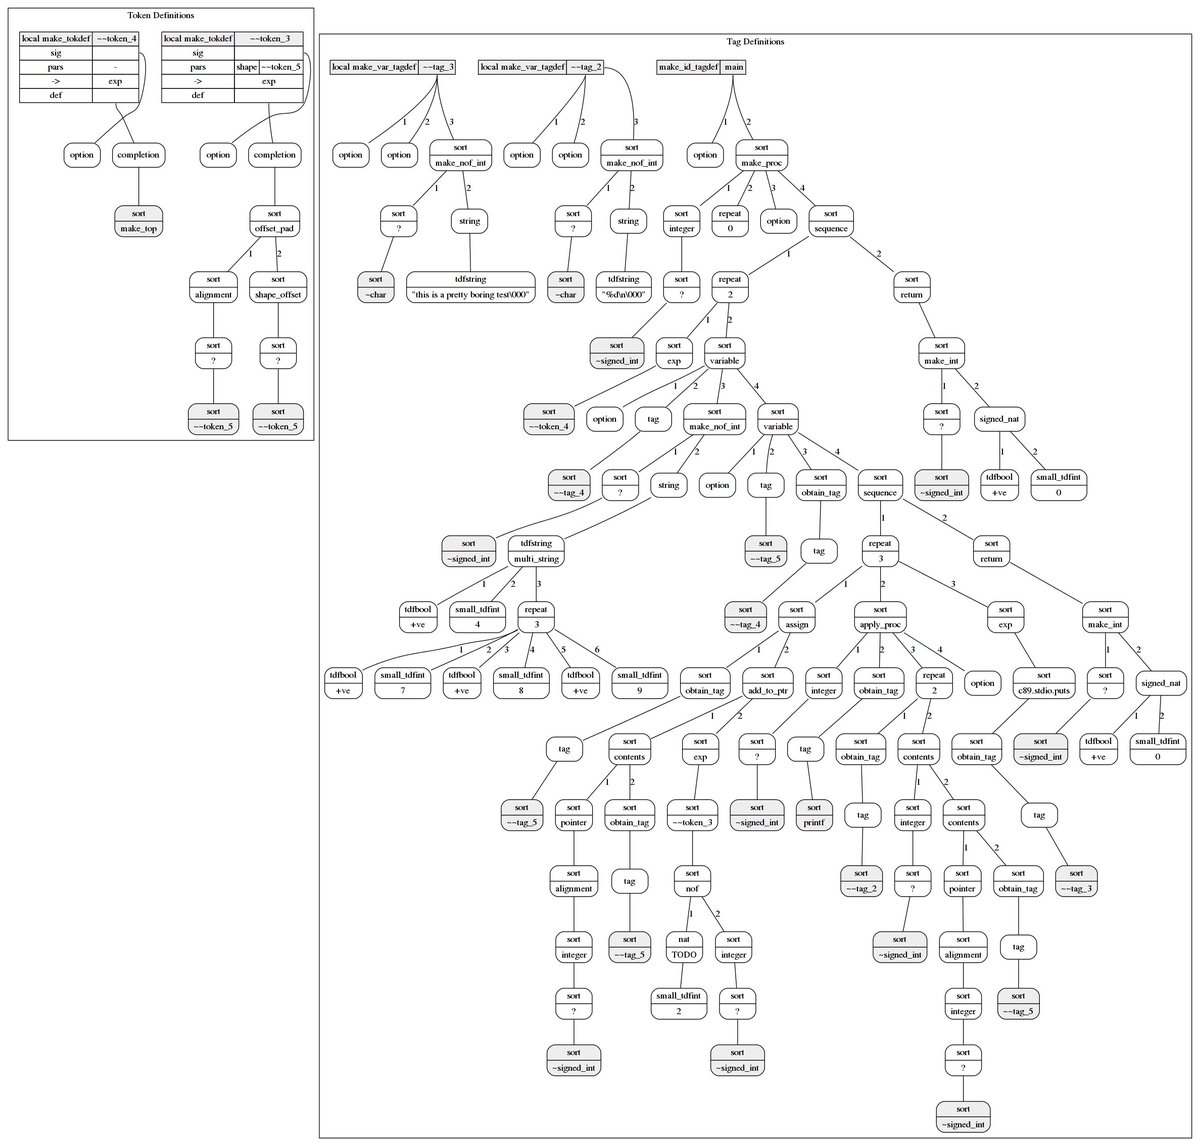
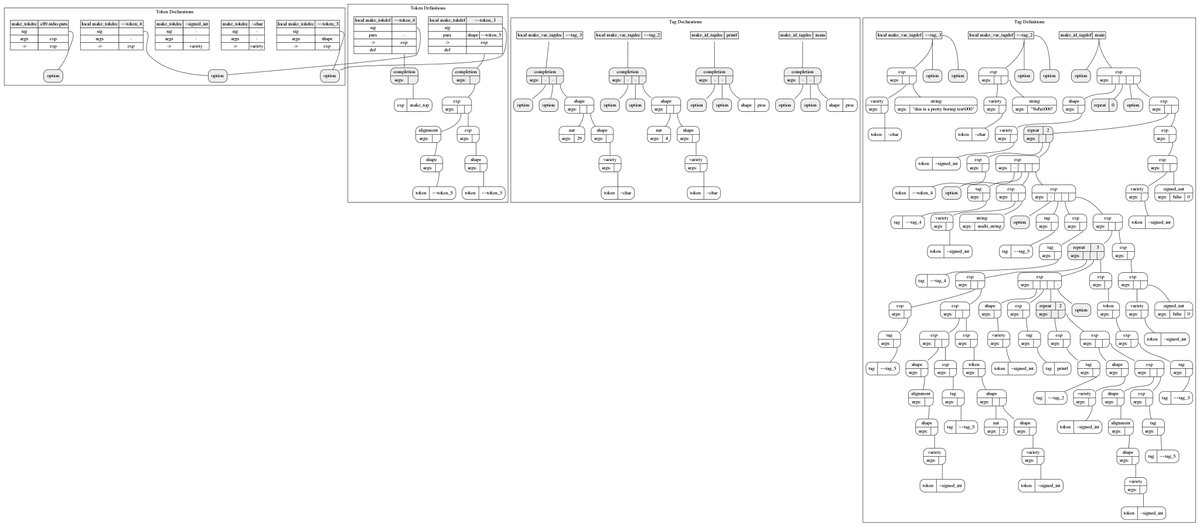
These structures can get big! But even zoomed out, seeing the general shape of something can help you when debugging. When you're familiar with how things look, you can spot patterns in what changes. Our brains are good for that!
On structuring programs: Get the structure of the data right. Code is incidental to that. - Code is easier to change - Data design has a way of getting ingrained all over the place - That's why keeping it contained within phases (or modules or whatever) is important
For stateful daemons, add a way to query the current state over IPC. Do the rendering outside your program!
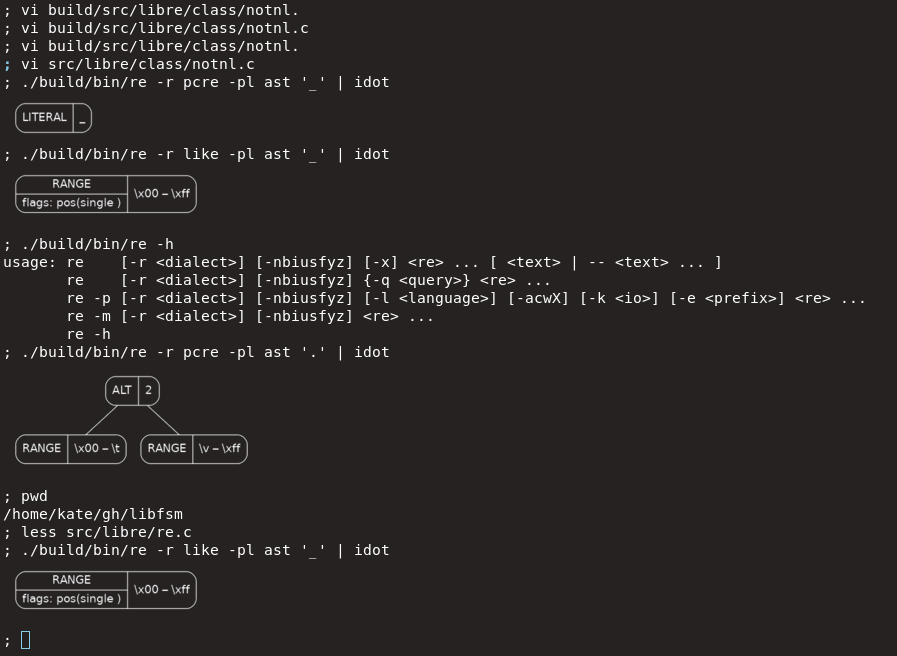
Output graphviz, json, simple TSV, anything that seems most natural for your data. Print in a *simple* format, use external tools to render it.
Just because you have a program, doesn't mean your program should be responsible for all this stuff. Break things up! Use different languages. I use awk. You use whatever language you enjoy.
json is good common currency between teams using different languages. If you're working commercially, use it as social glue, and score yourself some principle engineer "collaborates between teams" points.
Keep colours colourblind friendly, and for functional information only. I like Bang Wong's palette. https://www.nature.com/article...
Workflow is important, both for getting data and for visualisation. It's no good if you have to do a bunch of stuff to see what you just made, and that interrupts what you're trying to do. Next time i'll try to write a bit about that. Take care, thanks for reading.
@thingskatedid Sorry maybe I missed but whats the name of this code visualisation tool? What languages and diagram output formats does it support?
@philanid5 hiya! there's no one tool here. I'm suggesting that you have your programs print out data in whatever form suits them — in simple text formats — and render that externally to the program. graphviz is one option for the rendering! its format is called Dot.
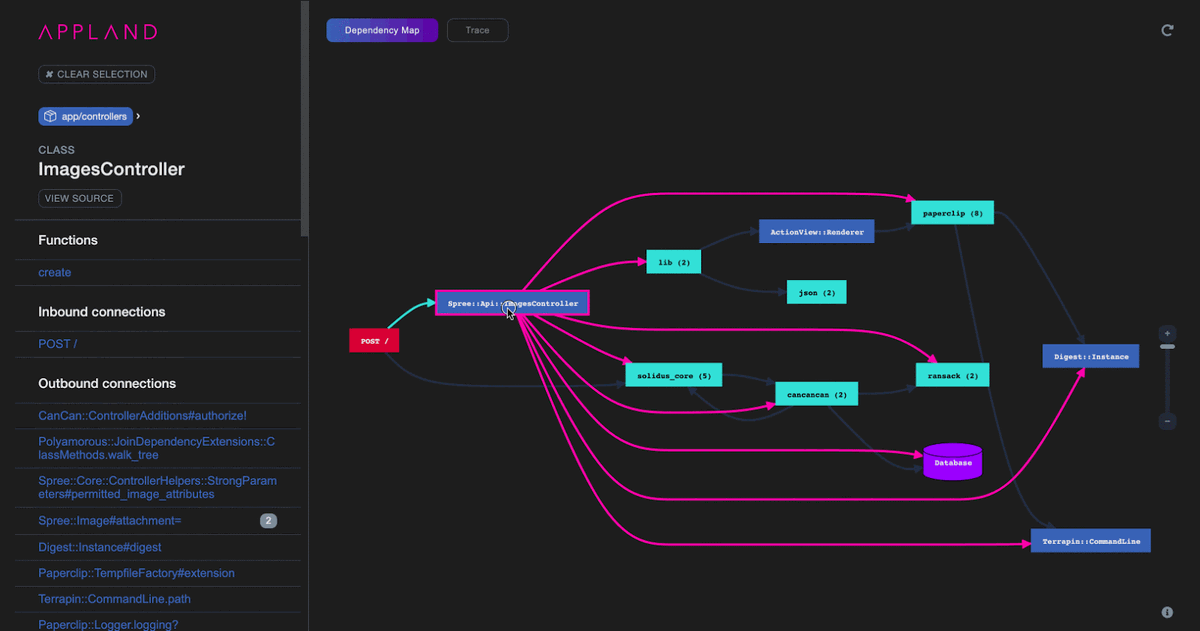
@thingskatedid Whoops I am late to this thread, but I'm very much engaged in bringing this capability to *everyone* - here's an example of our OSS tool, AppMap - for #rubyonrails #Python #Java @code - more info at https://appland.com/docs/get-s...
@thingskatedid I keep bookmarking Kate's threads....this is #2 or 3.
@thingskatedid Yes! This is the web view of the internals of my Prolog virtual machine. At each step of the execution, the machine dumps its state as JSON into a file, producing a JSONL file at the end. This page has certainly saved me more time debugging than I spent on writing it.

@brunokim_mc lovely!
@thingskatedid Yes! Used exactly this technique when debugging the internals of @ApparanceUK. Custom code to dump graph, trigger GraphViz, and open the result, all within the editor session. :)

@ga5p0d3 @ApparanceUK nicely presented! that looks great
@thingskatedid have you written about your work flow for this anywhere?
@pyribi A little in my pinned tweet, but not for debugging specifically yet, no.
@thingskatedid Several years ago I used Lex to partially parse C and output PS so I could check numerical analysis assignments for cheating (way before I knew anything about compilers… I could do a bit better now). I'd print these and eyeball for blatant similarities (I caught 3 cheaters) :)

@berenguel oh wow. that's a brilliant idea
@thingskatedid i would love to do this but i am not good at building custom tooling and nobody has bult this yet that I know of
@muscovitebob hi there! Start with Graphviz. it takes a simple text format as input; try writing some by hand. all I'm doing here is having my programs output that same text format. It's less custom stuff than you think!