
I spent over 100 hours studying the best patterns in Technical Analysis taught to me by @niki_poojary. Turns out, patterns trading is simple—if you follow these 8 Patterns:
Let's start: ↓ While studying her Twitter profile and with constant talks with her, I found these to be the most important patterns she focuses on always. Then I wrote a small summary of what each pattern means. Also attached are some examples from her tweets.
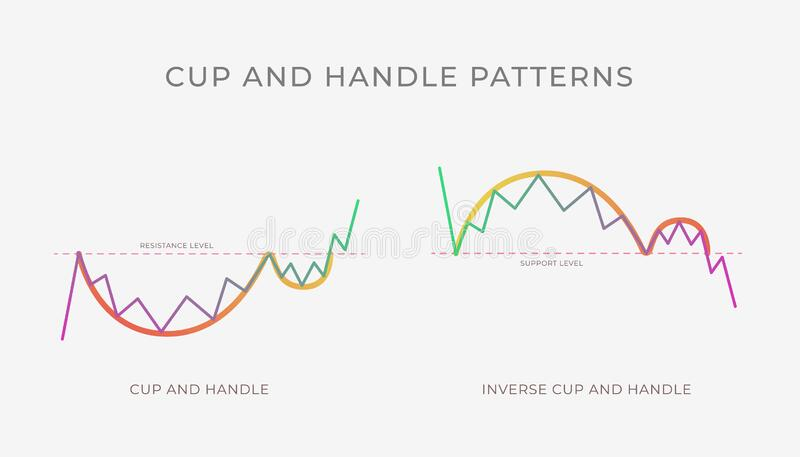
1/ Cup and handle Pattern Happens during an uptrend. The cup portion has a U-shaped appearance. The bears are getting weaker as they are unable to drive the prices below the last low. Subhasish Pani uses this a lot in stocks to spot bullish trades.
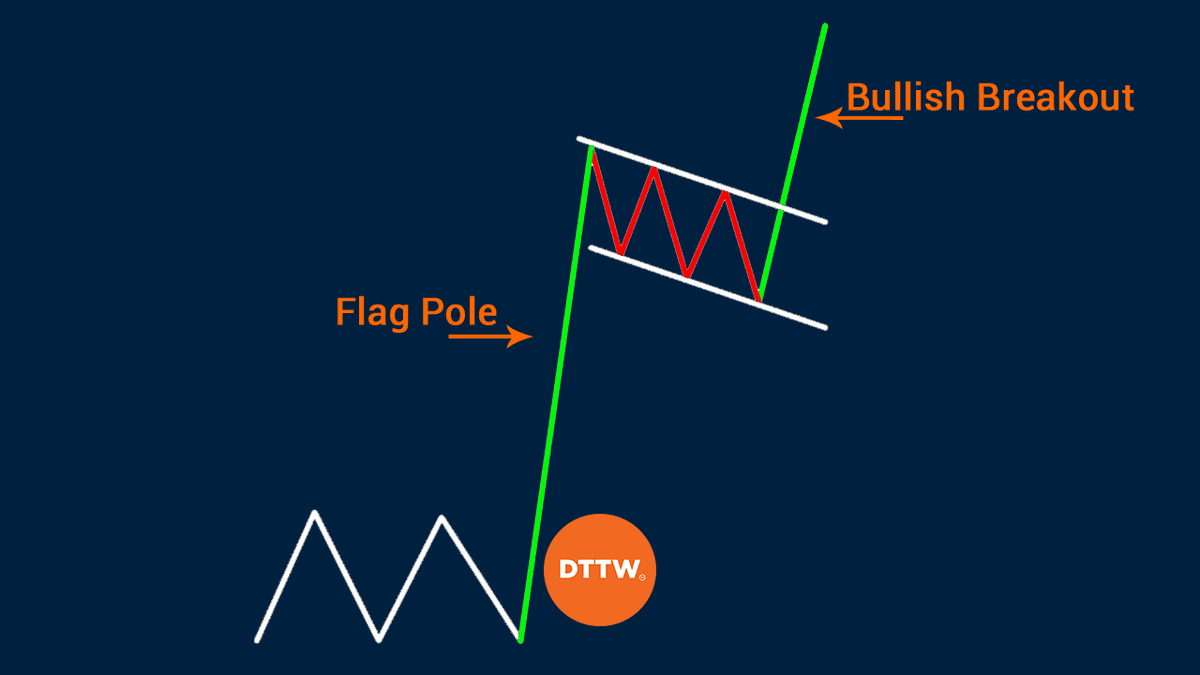
2/ Bullish Flag Pattern Happens after a trending move. After constant lower lows in a downward-sloping rectangle, the market breaks out. These patterns are very powerful if the down move is still higher than 50% of the distance of the up move.
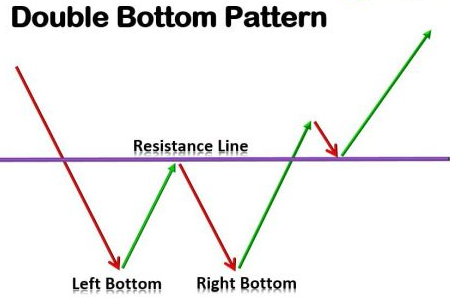
3/ Double Bottom Pattern It is a bullish pattern that has the shape of a "W". The market tries twice to break the lows but is unsuccessful. This is a reversal pattern to observe during a downtrend for a bullish trade.
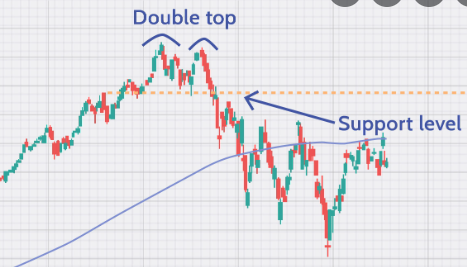
4/ Double Top Pattern It is a bearish pattern that has the shape of an "M". The market tries twice to break the highs but is unsuccessful. This is a reversal pattern to observe during an uptrend for a bearish trade.
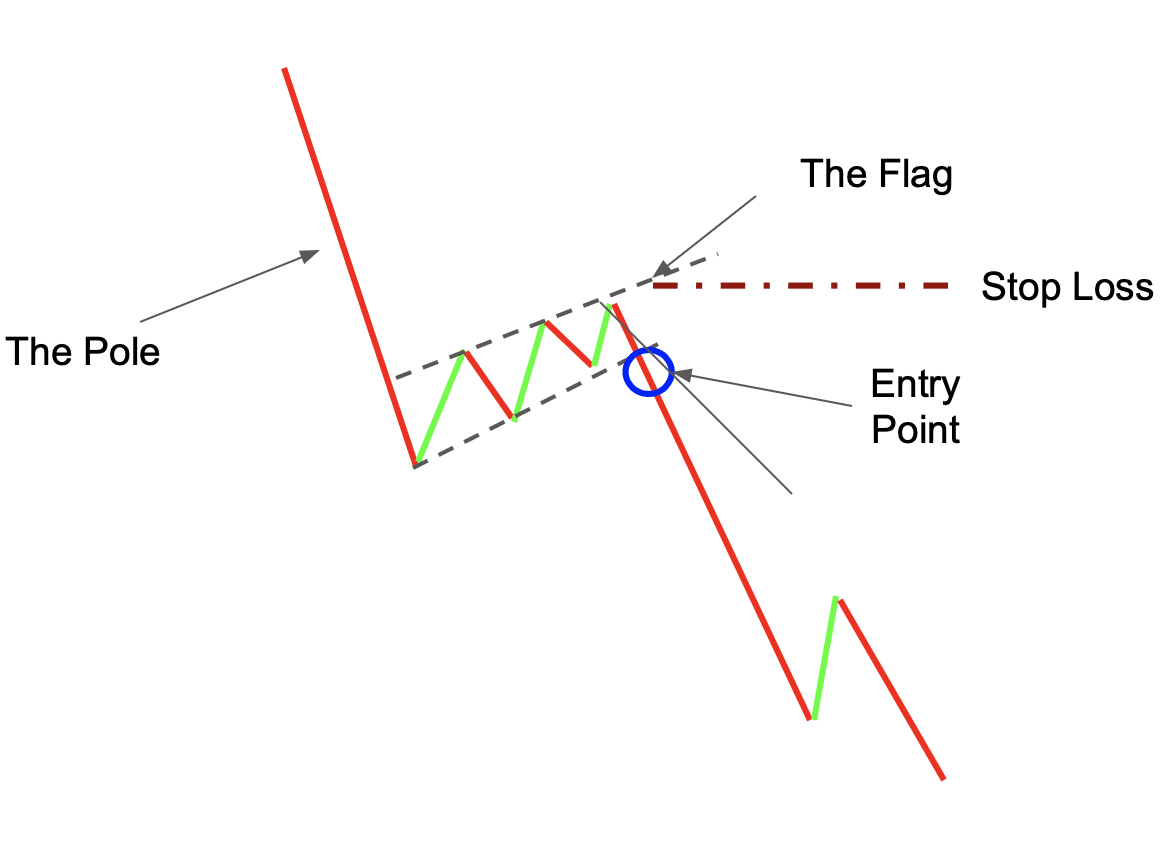
5/ Bearish Flag Pattern Happens after a trending move. After constant higher highs in an uptrend-sloping rectangle, the market breaks down. These patterns are very powerful if the up move is still lower than 50% of the distance of the down move.
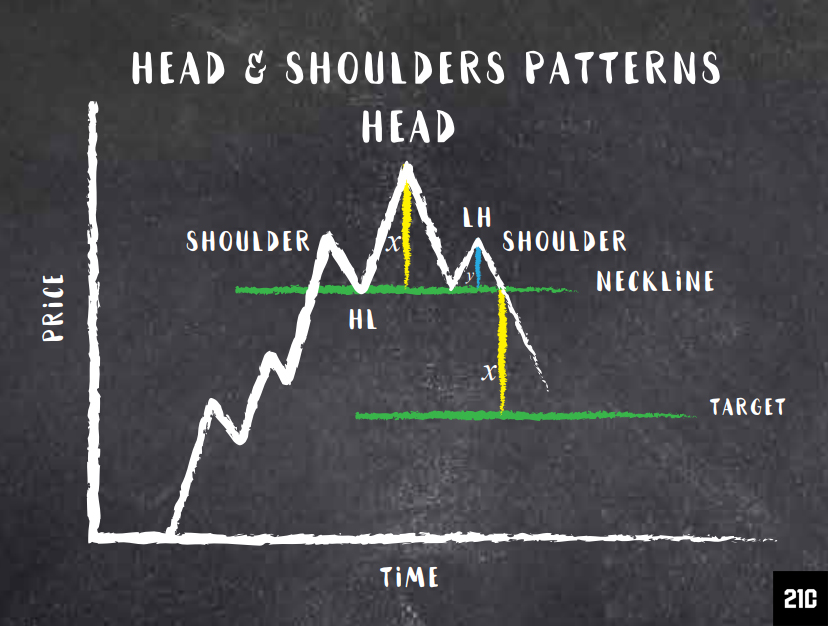
6/ Head and Shoulders Pattern Signifies a change from a bullish to a bearish trend. The bullish momentum is reducing as bulls are not able to take out their highs with force. Bears are fully in control. We look for a trade below the breakdown of a support in such patterns.
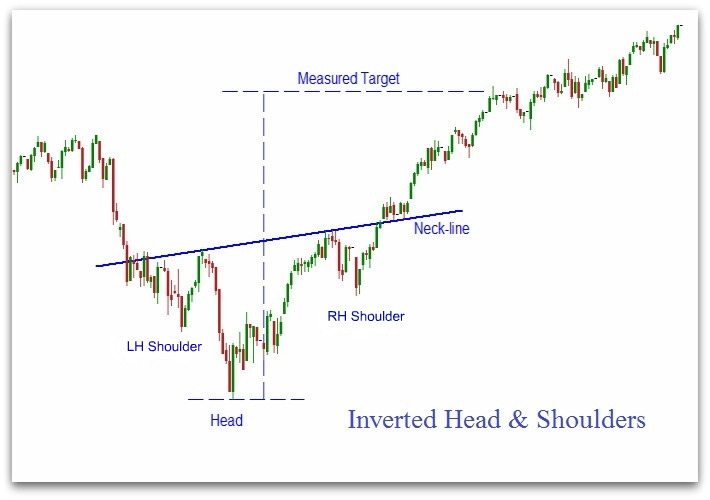
7/ Inverse Head and Shoulders Pattern Signifies a change from a bearish to a bullish trend. The bearish momentum is reducing as bears are not able to take out the lows with force. Bulls are fully in control. We trade above the breakout of a resistance in such patterns.
8/ Inverse Cup and Handle Pattern Happens during a downtrend. The cup portion has a reverse U-shaped appearance. The bulls are getting weaker as they are unable to drive the prices above the last high. Subhasish Pani uses this a lot in stocks to spot bearish trades.

That's a wrap! If you enjoyed this thread: 1. Follow us @Adityatodmal & @niki_poojary for more threads on Price action, Option Selling & Trading growth. We've got you covered. 2. RT the first Tweet to share it with your audience. I appreciate it!