
let me post some 100 #fibbonaci number wonders on long term chart. Post your chart too with #fibbonaci, make sure chart is clean.
this is number 1 in list #ibrealestate in 2021 it was one of the hot stock - Infact I was also excited took entry at top despite I was seeing Golden ratio rejection. what happened next is history.

the very same stock took eyeball again few months back -- people went gaga even we went long -- but exited sharp at 61.8% checkout the result #Fibbonaci


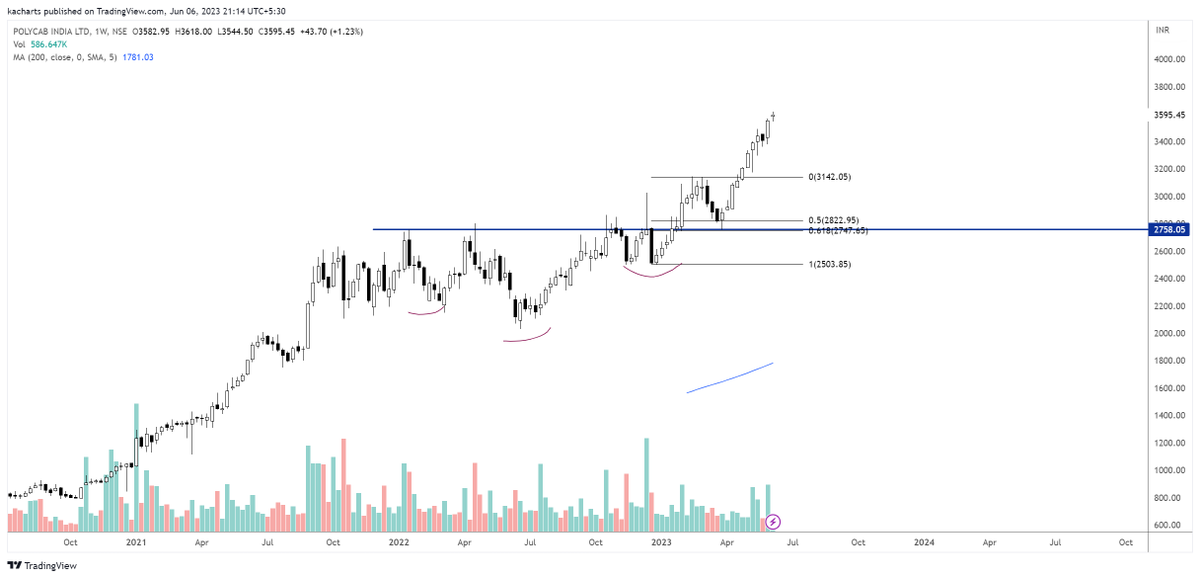
such setup forms rarely #stronguptrend #breakoutretest of inverse H&S and at retest 61.8% that too hammer mind it -- hammer works best in strong trend pullback. #polycab again many times discussed in my webinars.
when upmove in IT stocks started in SEPT 2022 -- Infy being darling stock was most talked and was said this time gap will fill Check both charts #INFOSYS #Infy


lets see today #ITindex meltdown with the eyes of #fibbonaci

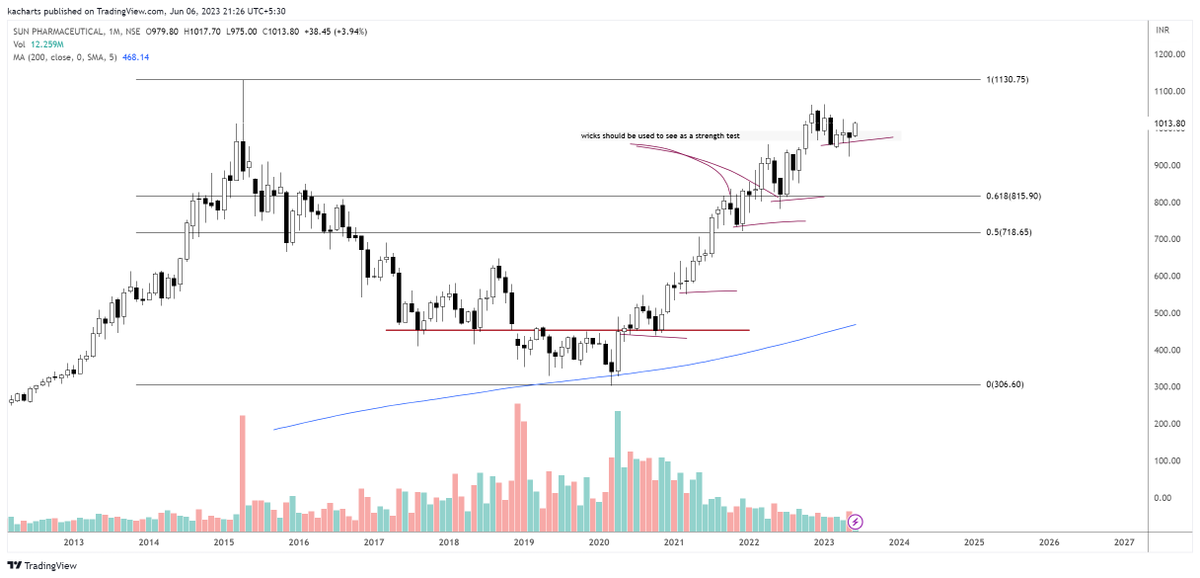
#sunpharma how you are going to understand -- stock has changed trend or not? simple answer - if on higher TF HL --HL formation start u can understand how u will be dead sure now strong momentum and new high is abt to come? Check price behavior's at 61.8% Golden ratio act as
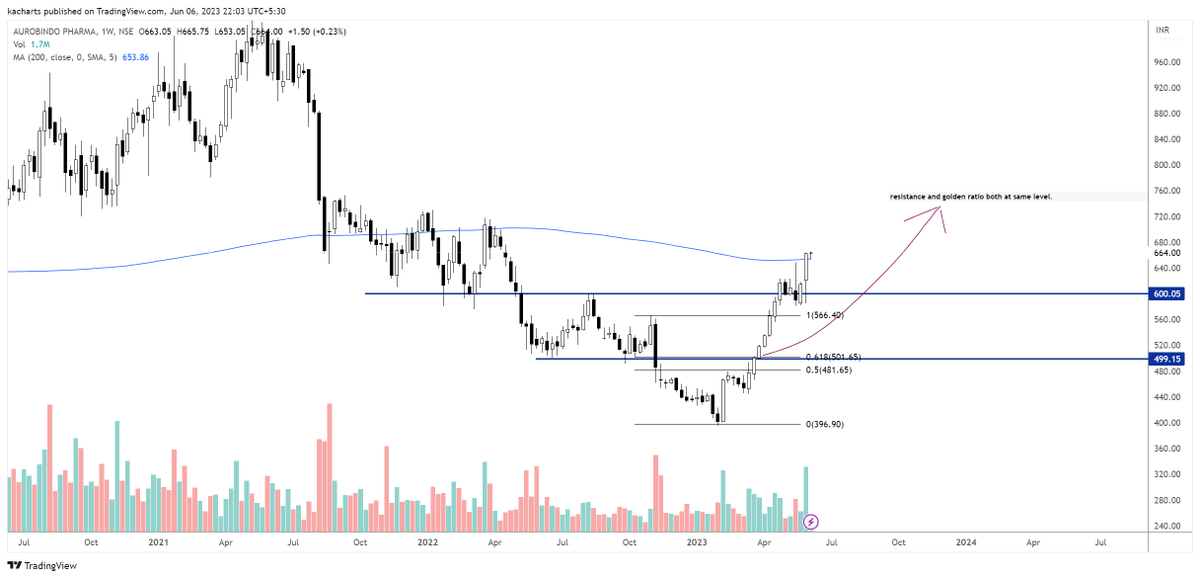
check this out I was tracking this stock from many days check both charts Trend to badalna hi tha. #Auropharma

https://x.com/KA_charts/status... my recent explanation on #KPIT fibbonaci
remember sometimes price doesn't come exactly at 61.8% after 1st test but when price action gives u support -- never hesistate in going long. With my understanding and experience I can say now we wont see 730-740 levels in #mcdowell Stock was well discussed by me on youtube


https://www.tradingview.com/x/... #adaniport when u want to trade a news driven stock - better look for higher time frame confluence 61.8% and support coincide. check both chart for better understanding https://www.tradingview.com/x/...
very interesting- Just saw @suru27 #marksons tweet. Saw chart 1) stock was in corrective phase after 2020- massive upmove. 2) retraced till 61.8% and formed a hammer 3) lower high formation turned into higher low after breaking swing. trend changed and stock now back to 52 week

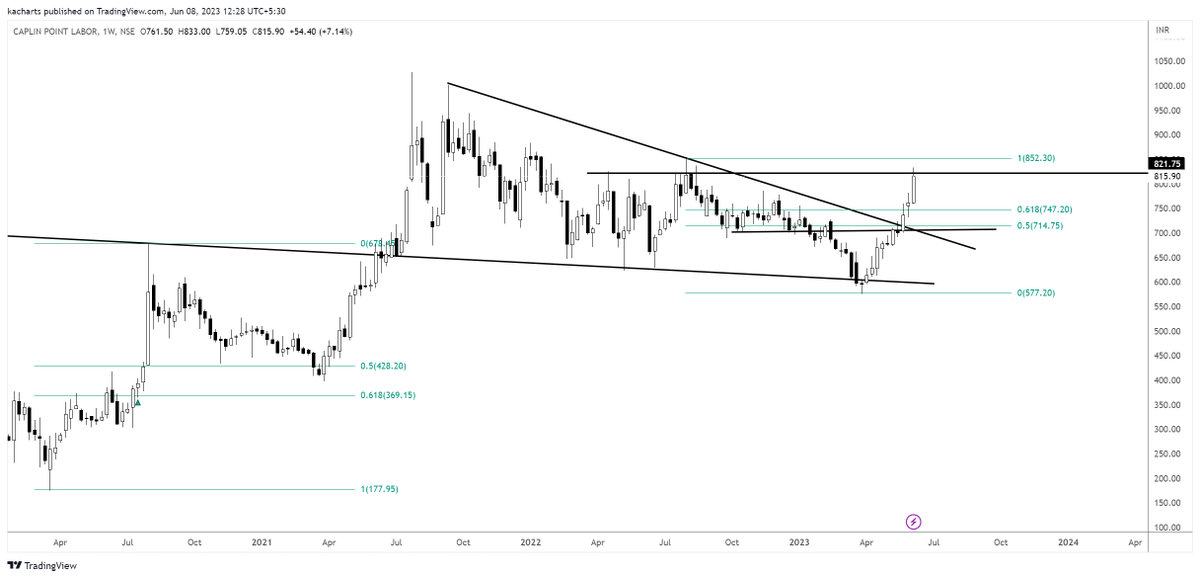
discussed this in webinar - 61.8% is acting as support #caplin
the thing is Price action is a leading Indicator - It tells u support and resistance but does support and resistance tells u where next move can come? Infact nothing tells that - we can only guess what can happen next by the help of 1) trend 2)fibbo extension if trend is

https://www.tradingview.com/x/... now when price will start reversing from here - just saying-- and will break 61.8% -- we can anticipate the price will break major trend 61.8% and will reverse the bearish trend to bullish. this was case 1
case two which seems more likely price retrace till 61.8% as per chart and then start uptrend again. #niftyIT

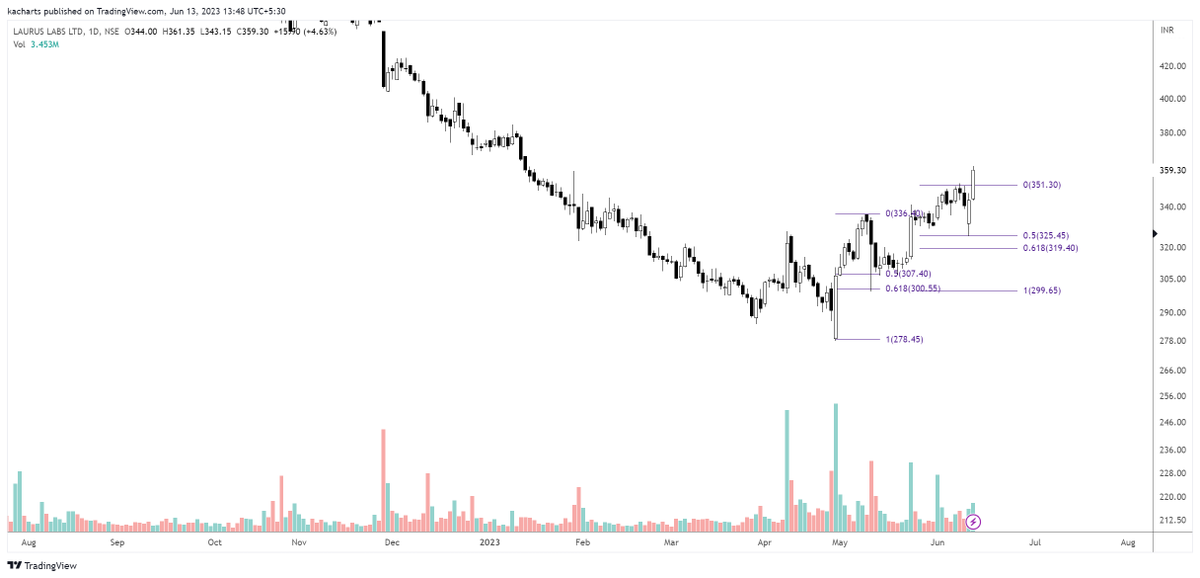
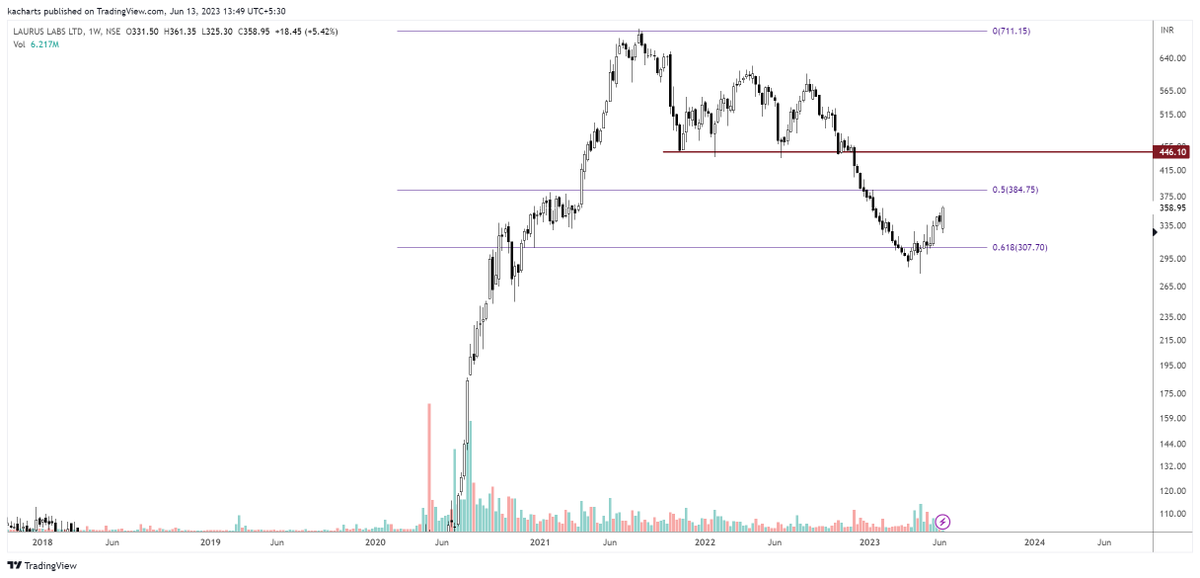
a much discussed stock today #lauruslab It was covered 10 days back by me on basis of again #fibbonaci this is current scenario
https://www.tradingview.com/x/... #rainindustries stock was in strong uptrend retraced and now resumed uptrend by breaking swing high and now retested it.