
alright, gonna go over TA basics in this thread and how you can use very simple TA to get better entries and exits if you've always struggled to draw your own supports and resistances or were confused about them, this should help you out *ah shit, here we go again*
When you look at a chart, you should be able to: - spot it's current trend (Uptrend or Downtrend) - spot key levels of support and resistances you can then use them to buy (near) bottoms or exit (near) tops.
1) Uptrend - An uptrend will be a continuous set of higher highs and higher lows - Previous higher highs become supports (support = where price is likely to bounce) and the trend goes on

example of an uptrend (ator)

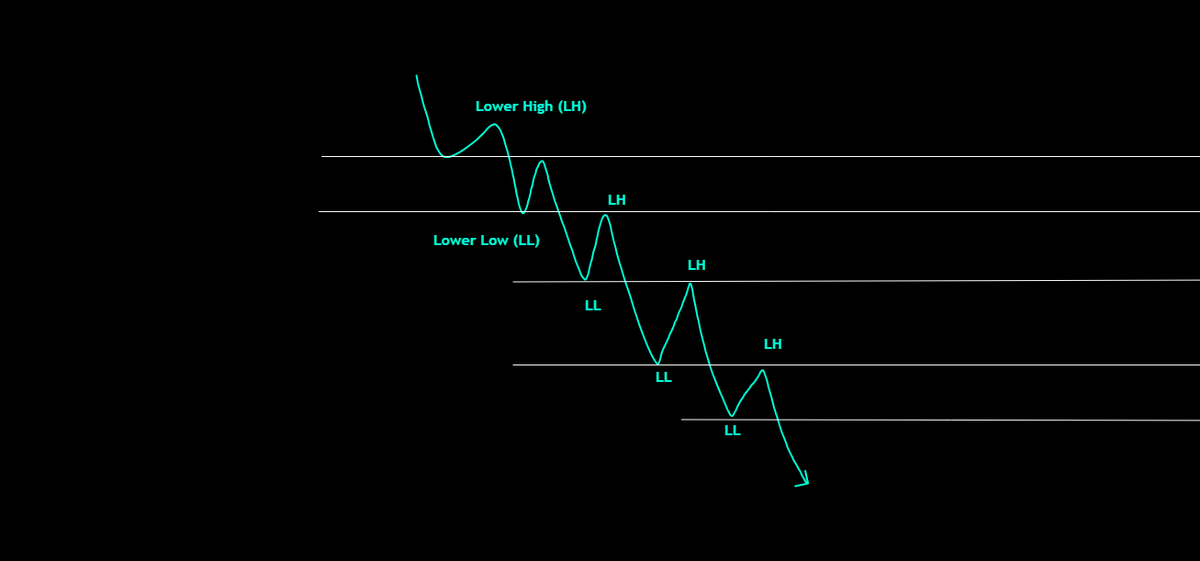
2) Downtrend - Downtrend is the opposite, you'll see clear sets of lower highs and lower lows - Previous lower highs becomes resistance (resistance = where price is likely to reject/drop from) and the trend goes on
example of a downtrend (spx)
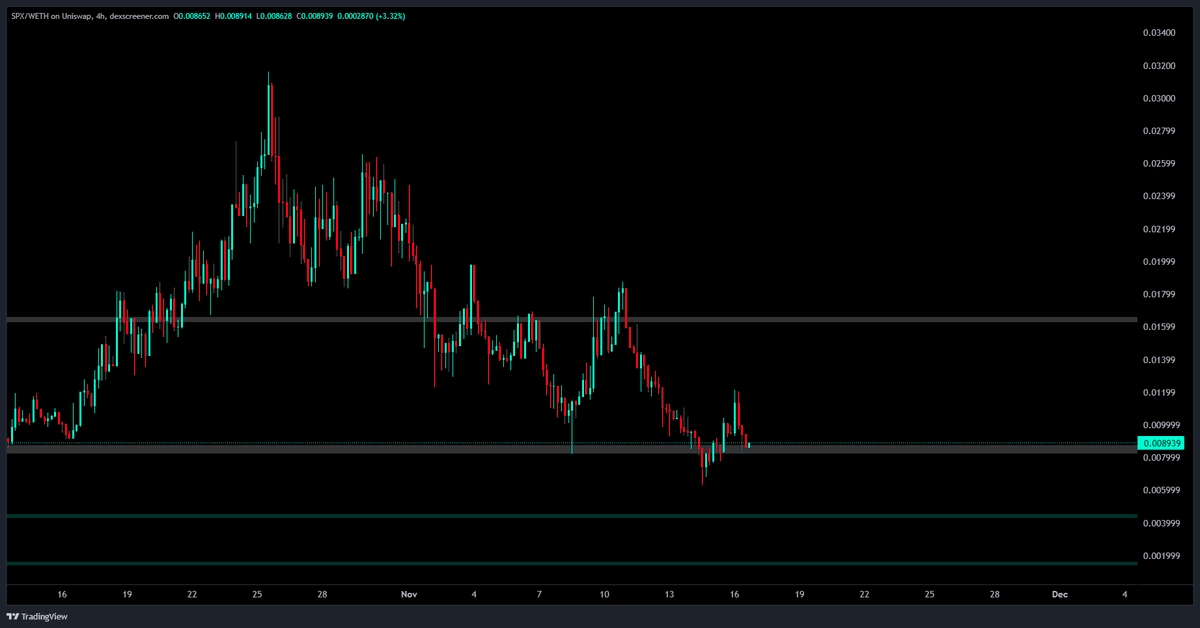
Spotting trend changes at the top (zoom for clarity) - usually on htf (high-timeframe) if you see clear signs of trend exhaustion/trend changes, you'll see solid retraces following later - if swinging these, best to exit once htf trend shifts and re-enter later

in this older thread of mine i've used this exact same method to exit at local tops on many coins, find examples of trend changes at tops there. https://x.com/jacknuked/status...
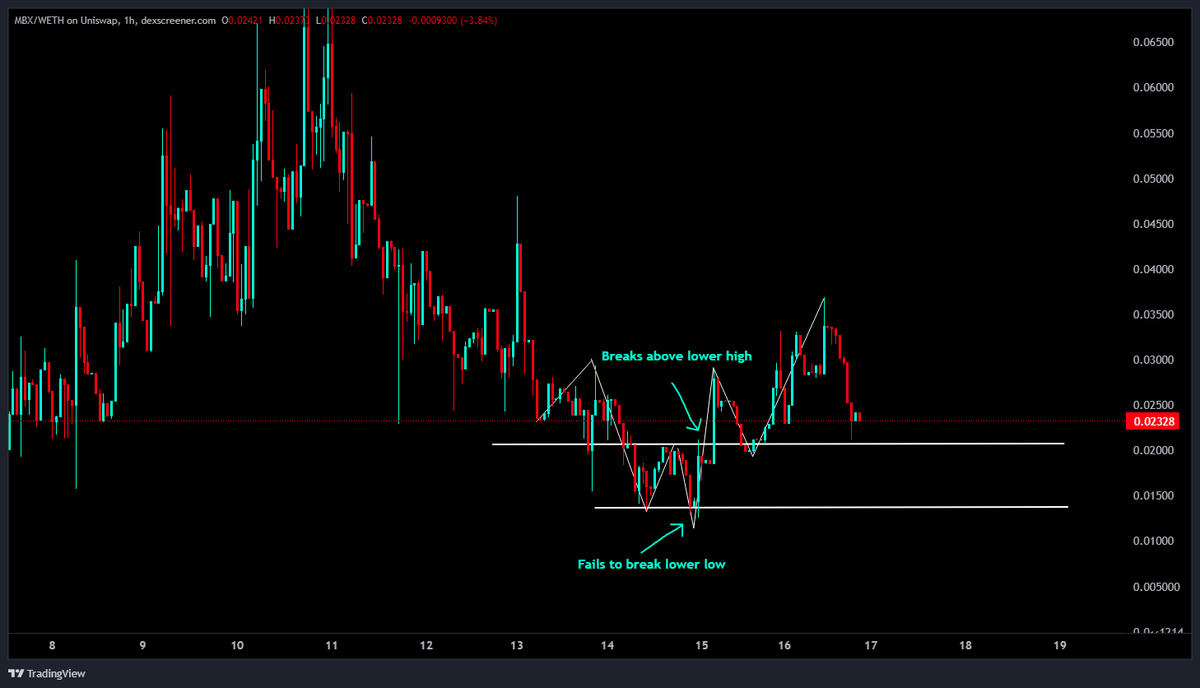
Spotting trend changes at the bottom (zoom for clarity) - optimally on htf if you see solid signs of a downtrend reversing, entering at the first break of lower high isnt usually a bad entry - sometimes form a range at the bottom to then break out of later

- entering when a chart fails to break a lower low provides good entries too, but riskier - more accurate on middle timeframe of high timeframe
example of a trend change at bottom (picked the most random chart in my tabs)
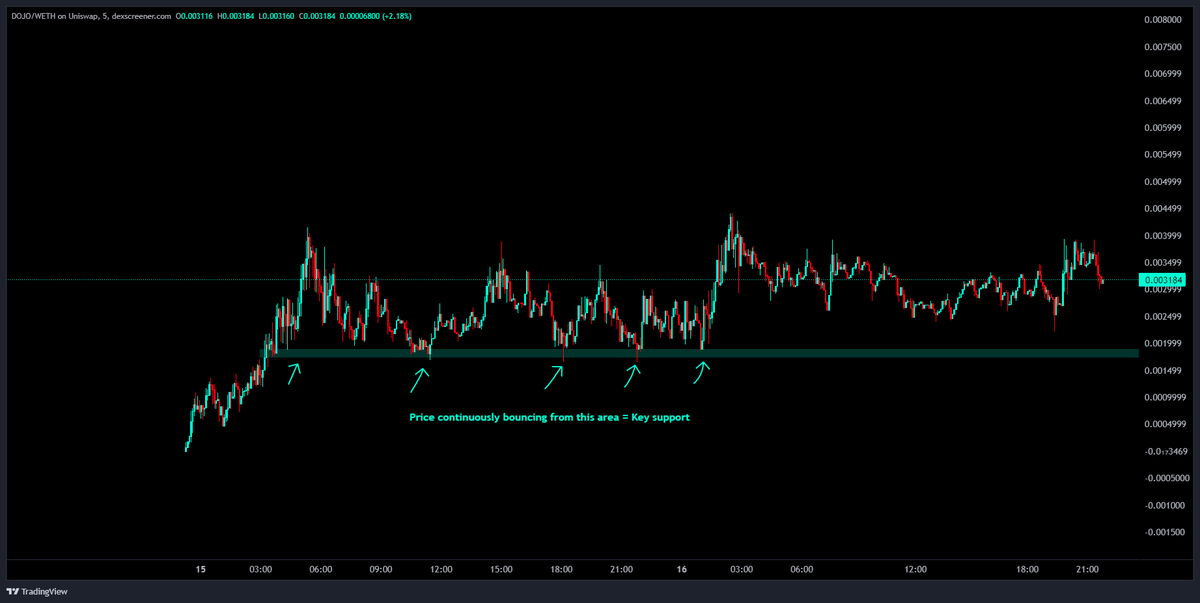
Spotting Key Levels - Key levels are zones on the chart where price is highly reactive, can be a key support or a key resistance - to find them, simply find out where price is dropping/pumping everytime a chart touches the area examples below
example of a key support - if lost (broken below) chart will revisit structural lows
example of a key resistance (on the same chart) - if broken out of with volume, presents good opportunity for upside
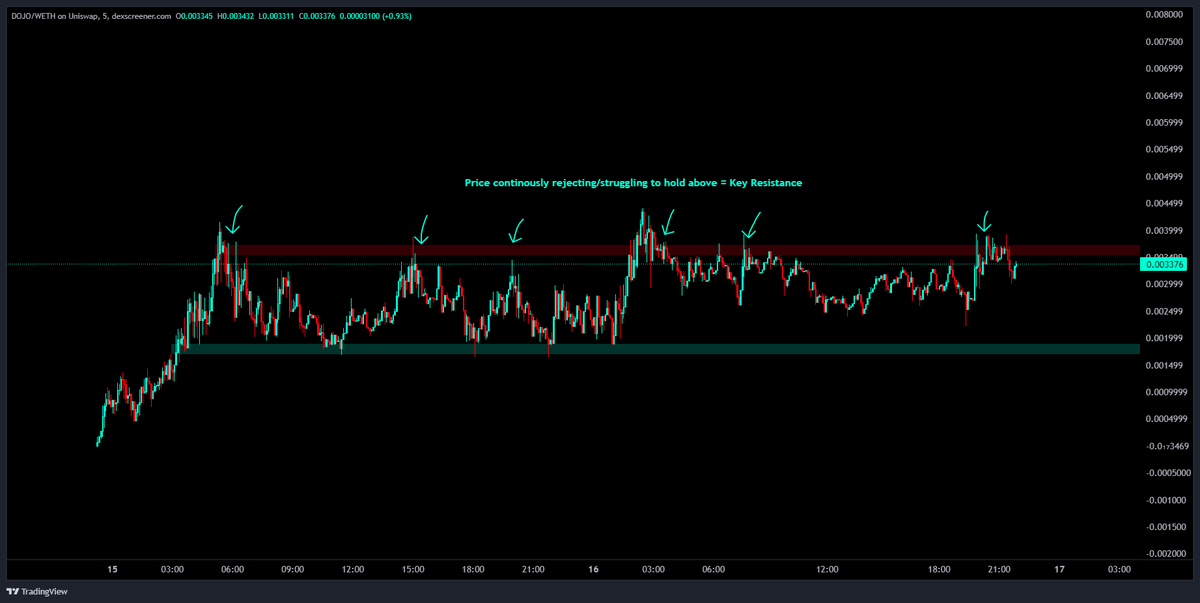
Spotting Ranges - Ranges are basically when price is supressed between a resistance and a support - price will ''zig-zag'' for a while to then either breakout or breakdown - clean breakouts provide good entries whereas breakdowns present further downside for price
explanation below

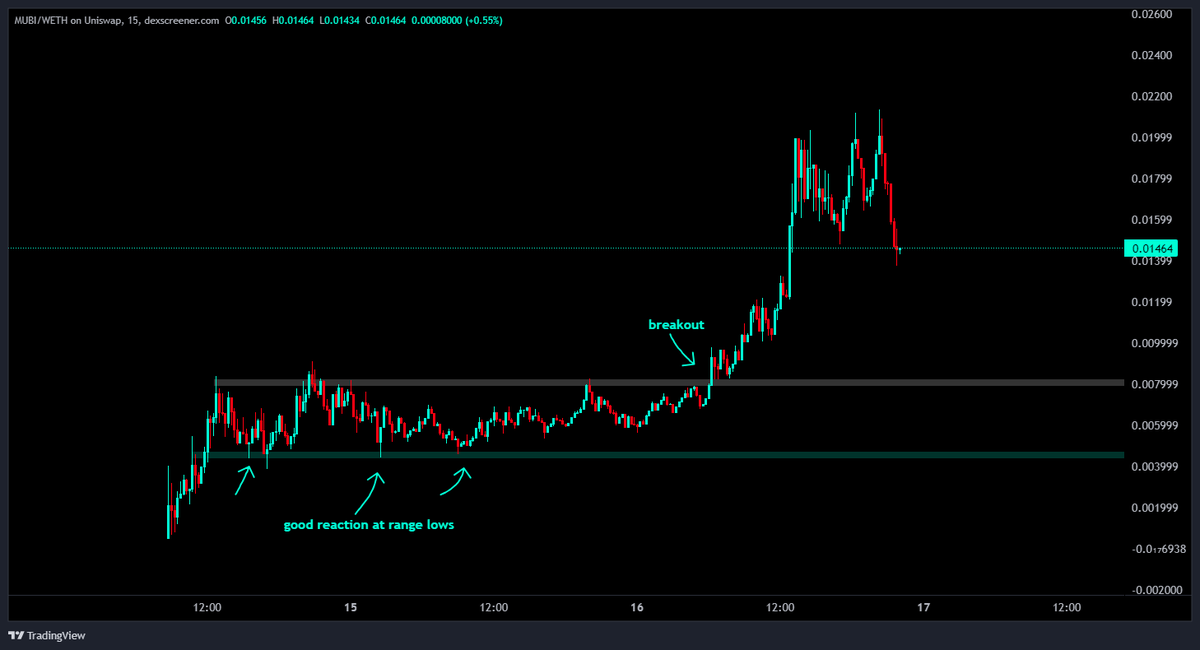
Playing a breakout scenario: - if volume is energentic and holders are increasing while the coin ranges, range lows provide a good entry - to be safer, get an entry on a clean breakout (RL = Range lows)
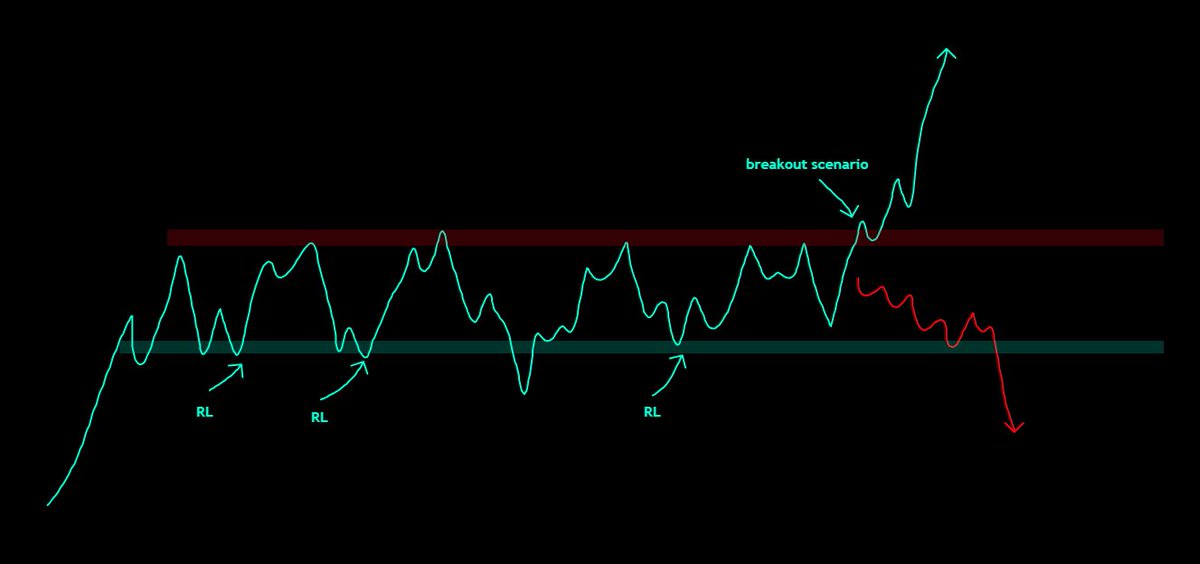
example of a range breakout scenario
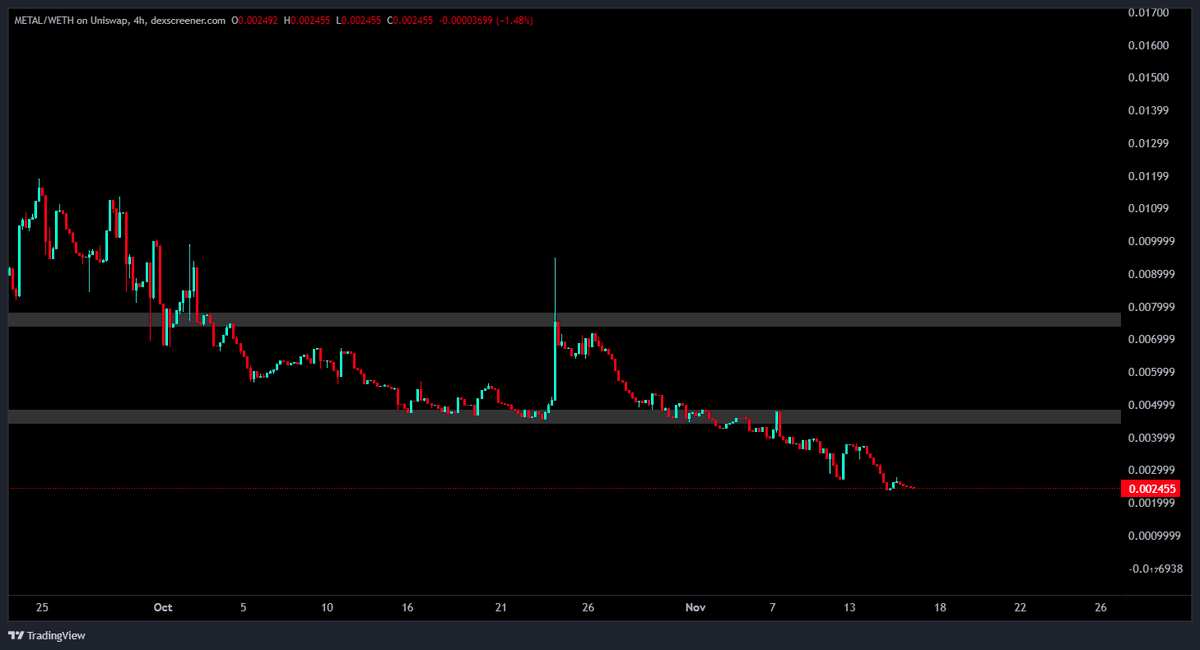
Spotting a breakdown scenario: - Each bounce within the range will get smaller - lack of buy volume at range lows - holders steadily decrease/neutral these signs are a clear indication of weakness and the range is likely to breakdown.
example of a range breakdown scenario
Some common patterns you'll see on shitcoins: i'd include real chart examples here too but that'll take way too long to find lol, out of memory here are the most common ones - Rising wedge (ends in a breakdown usually)

- Descending Wedge (ends in a breakout usually)

- This fkn triangle If towards the end of compression volume is high it'll breakout, if low, it'll almost always breakdown
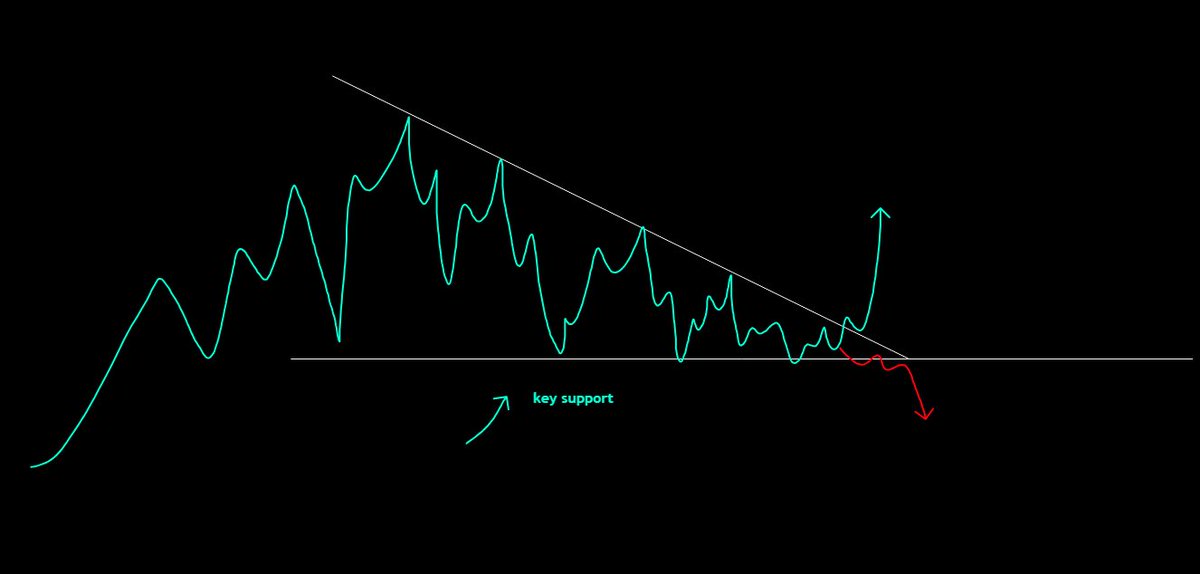
- First ATH retest happens a lot on new ''memecoins'' which are oversold for no reason, these charts will revisit the first ath they made before they went vertical and will bounce off it. usually a pretty easy flip of money

- Another common triangular pattern you'll see

That covers majority of the stuff when it comes to basic TA on shitcoins, you should have a solid idea by now. again, very important to mention that i don't guarantee it will 100% work on everything, but it is what has worked for me so far.
if this or any other thread helps your trading out, please let me know. thaaaa'ts it homies, cya for the next one.
@jacknuked Bookmarked for me
@jacknuked Retweeted for my mutuals ☺️
@jacknuked ❤️
@jacknuked Beautiful, tysm for this
@jacknuked yh?
@jacknuked GM and thank you ser for this... I've always struggled with this... Mainly played charts based off intuition... Sometimes good sometimes shit 🤣 But now I have a basic system in place to follow...been waiting for someone to compile it into something like this for ages 😭
@jacknuked Learned more from you in a week than from anyone else in a month. Allah bless u habibi

@jacknuked @threadreaderapp unroll
@jacknuked Unroll @threadreaderapp