
PRICE ACTION Simplified Let's start with👇 - VWAP - Support /Resistance - Pullback rejection - Sideways - Strength of Direction - Reversals Identifying Market & Day Type will change the way you trade. Mini Thread 🧵 Scroll down👇 to read fully

Before checking the Chart examples, -Don't waste time in indicators - Focus on the price action and price around important levels rest is noise. -Confidence to take trades will increase - when we have clarity about the current price action Follow me @learntotrade365 Scroll👇
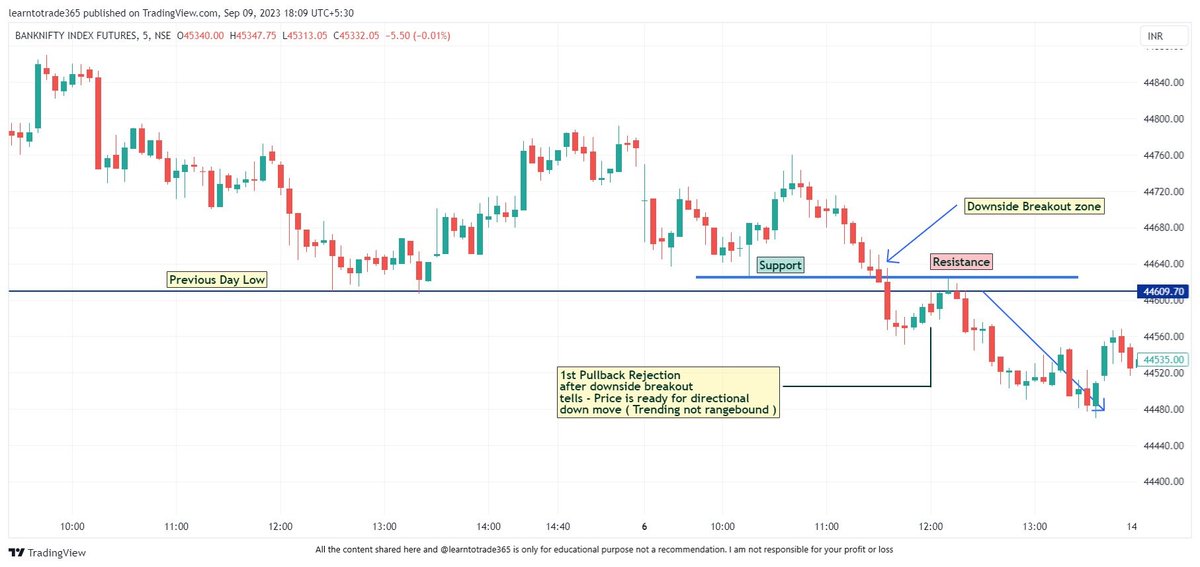
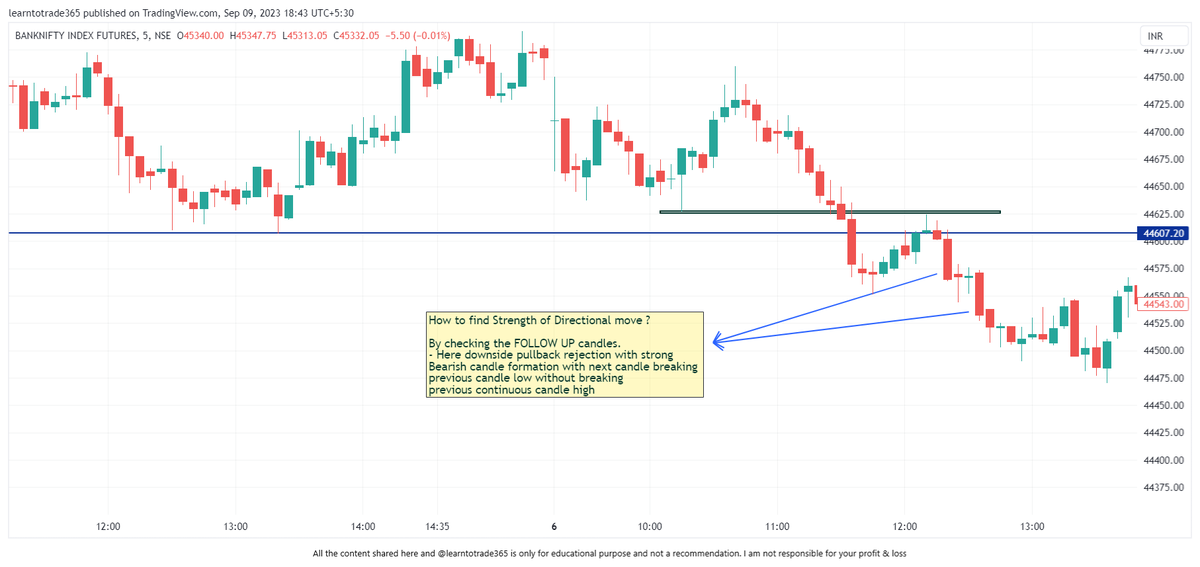
1] Directional market - Pullback is one of my favorite choice. Because it has, 🟢 Low Risk High Reward 🟢 Chance of Failure is less 🟢 Helps to follow the current market direction Check the chart to understand more clearly Scroll down for more👇👇
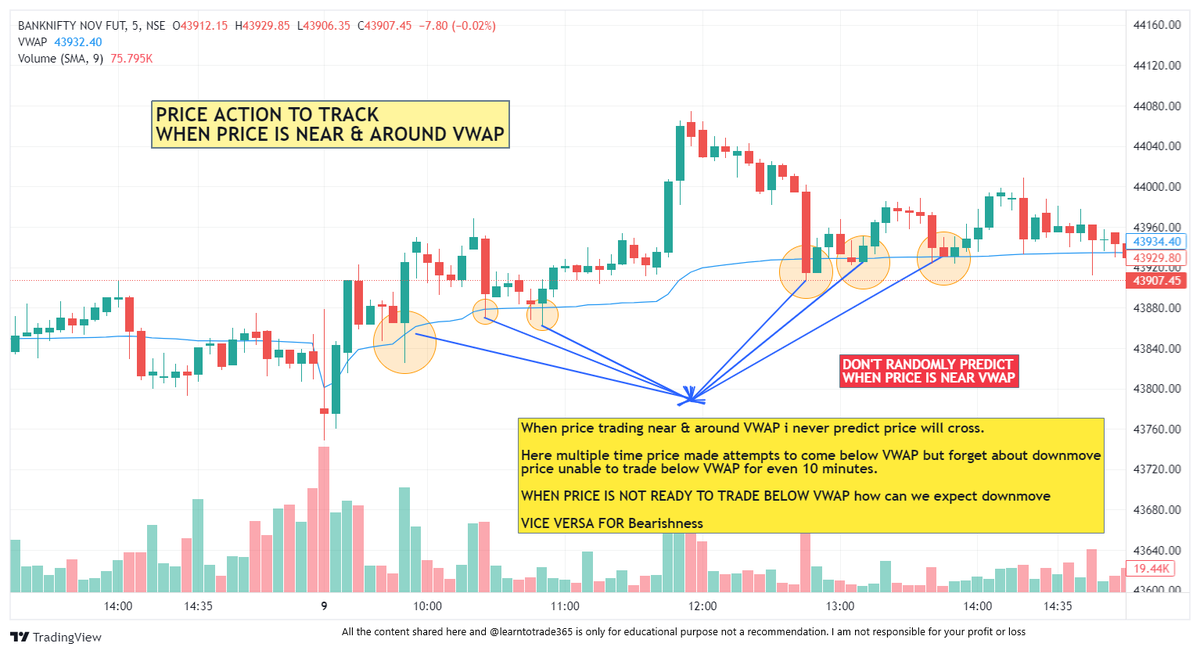
2] Never under-estimate VWAP Tracking Price action around VWAP is very important to get hint about current market trend. Check the chart to understand more clearly Scroll down for more 👇👇
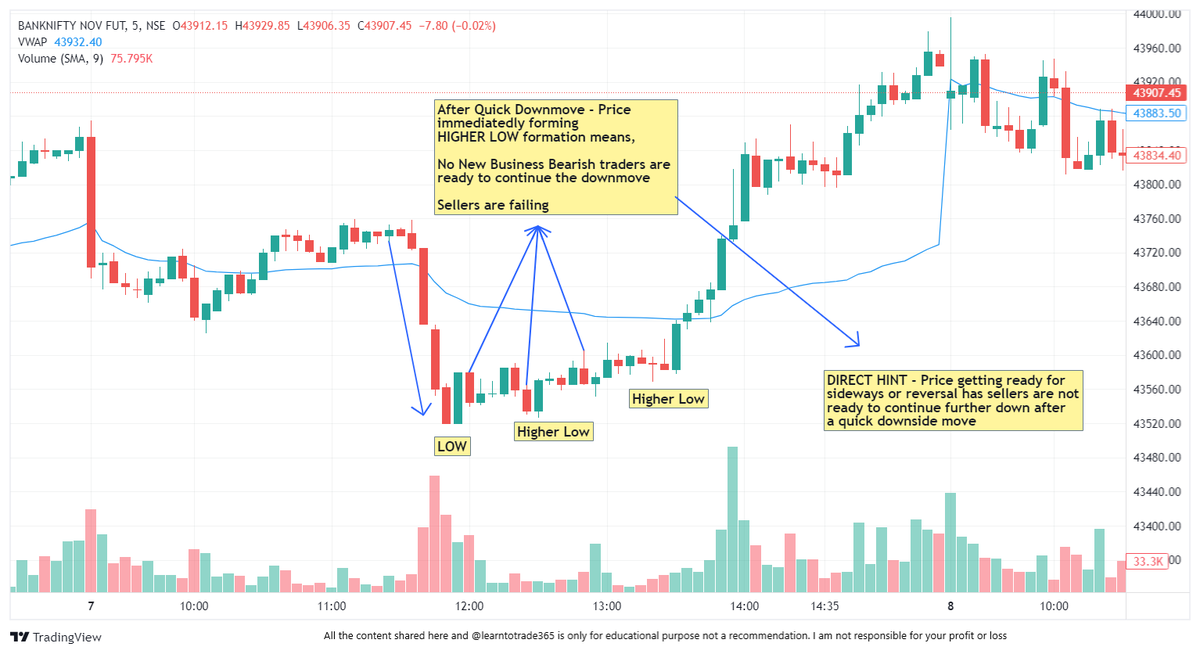
3] Hint for Reversal When price is making any quick/fast move - Always i track whether price is giving follow through the same direction or any hint for reversal. Check the chart to understand more clearly Scroll down for more 👇👇
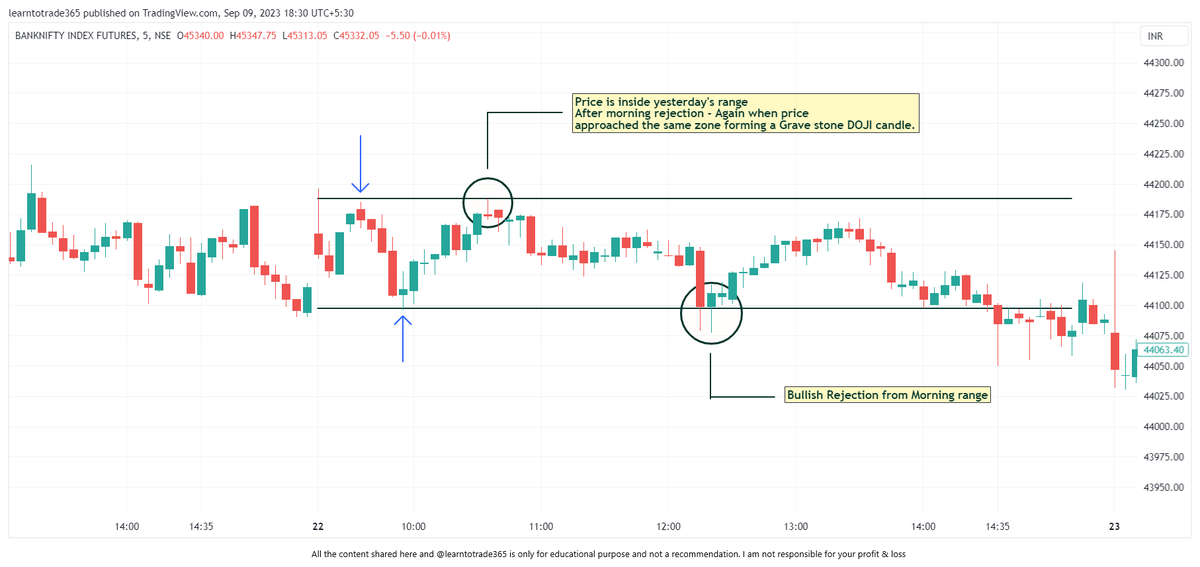
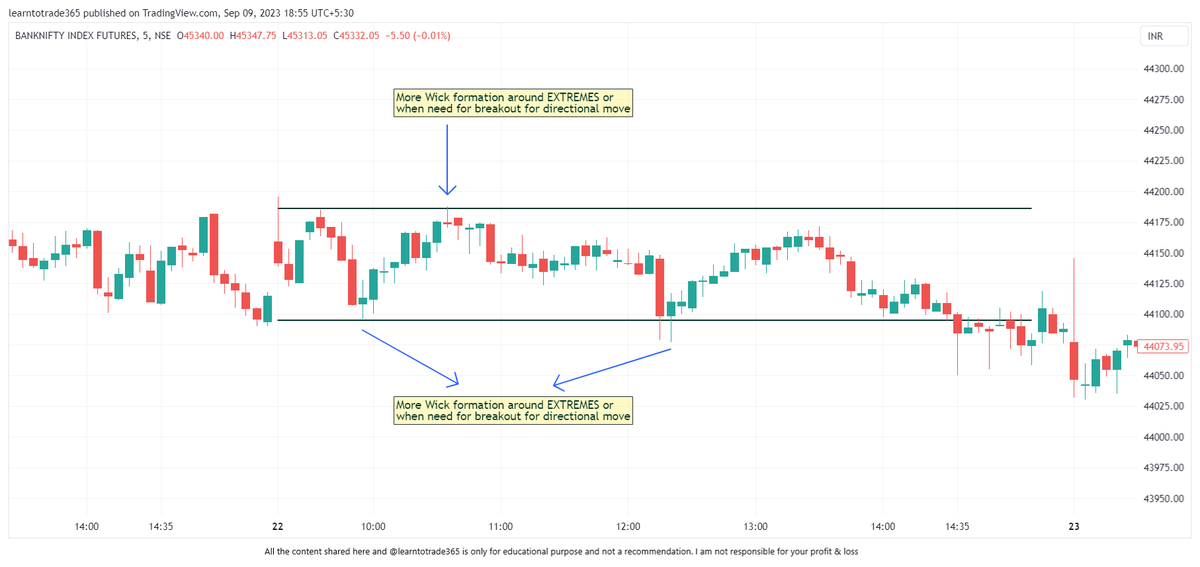
4] Range bound / Sideways Market - I focus more on EXTREMES of the sideways range. 🟢 Sideways market means stay away from middle of the sideways zone. 🟢 Reversal around extremes can give good entry location during sideways market. Scroll down for more👇
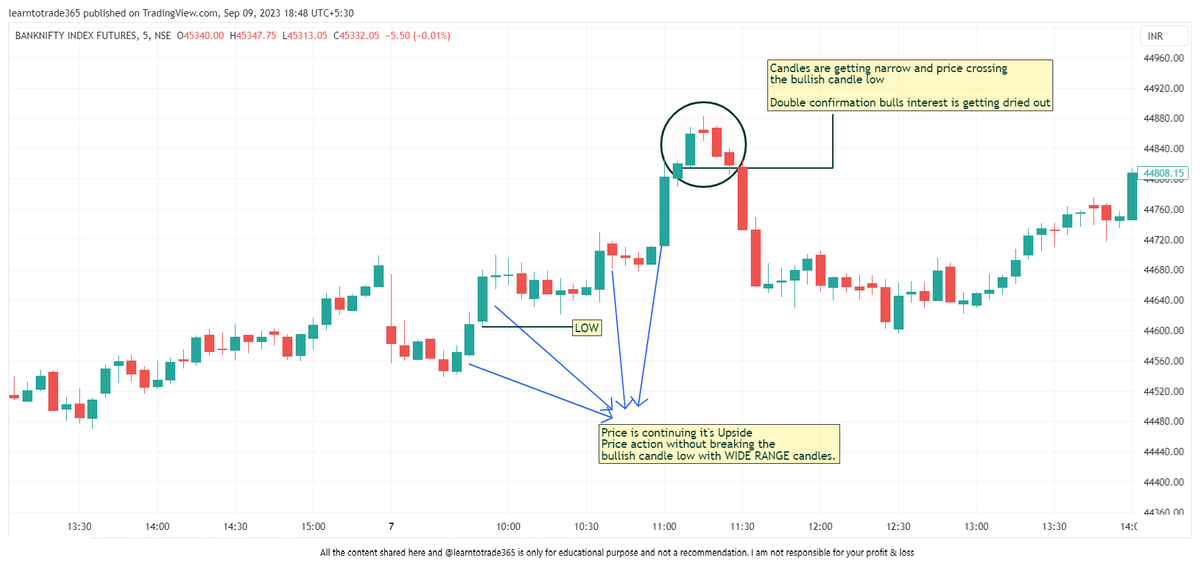
Follow through of price tells the real strength. Check the chart to understand the Strength of the directional move. When candle starts getting narrow the trend is fading away or interest is getting dried. Scroll down 👇
One more example this time upside. Check the chart to understand more clearly Scroll down for more 👇
Range bound / Sideways market forms more WICK Check the below chart to understand more clearly. Scroll down👇
End of this thread If you find this Thread useful - Do show your Love & Support by Like and Retweet the 1st tweet of this thread. Follow me @learntotrade365 for more content & techniques. Join the Free Telegram channel for Live market updates - https://telegram.me/learntotra...