
In this THREAD I will explain “Basic Trading Indicators” 1. MACD 2. RSI 3. Bollinger Bands 4. EMA 5. VWAP 6. Volume 🧵(1/10)
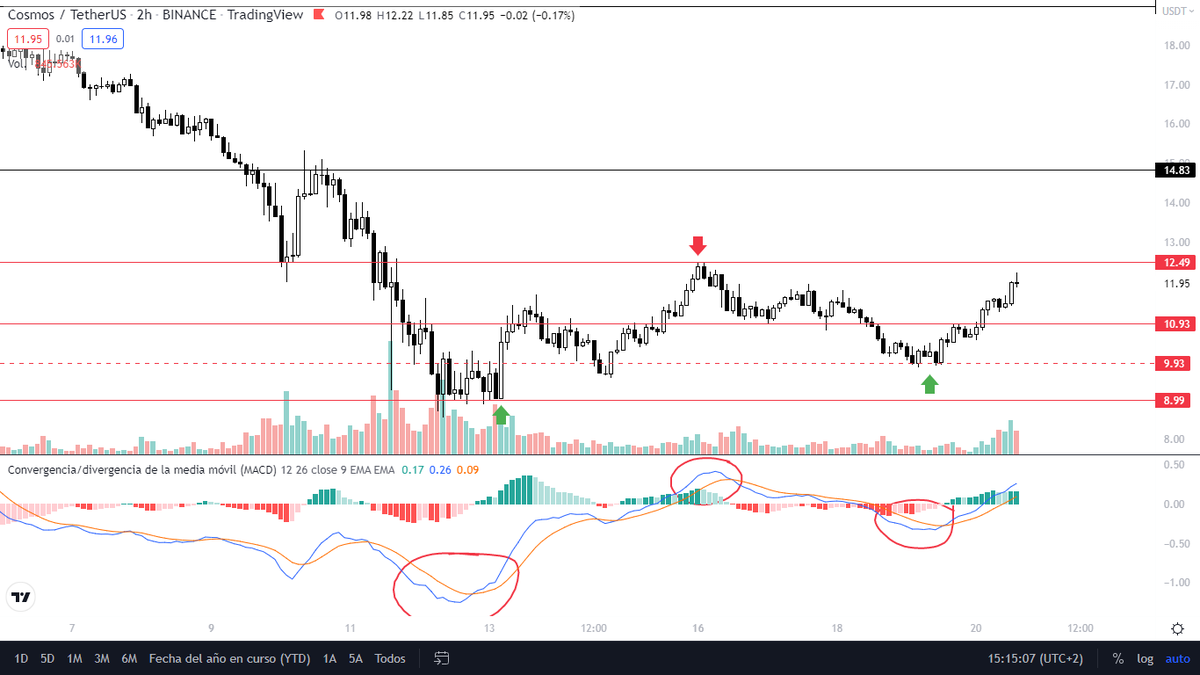
1. MACD MACD measures the convergence and divergence over time of two moving averages of the price of an asset. MACD indicates the separation between the value of two moving averages with different calculation periods.
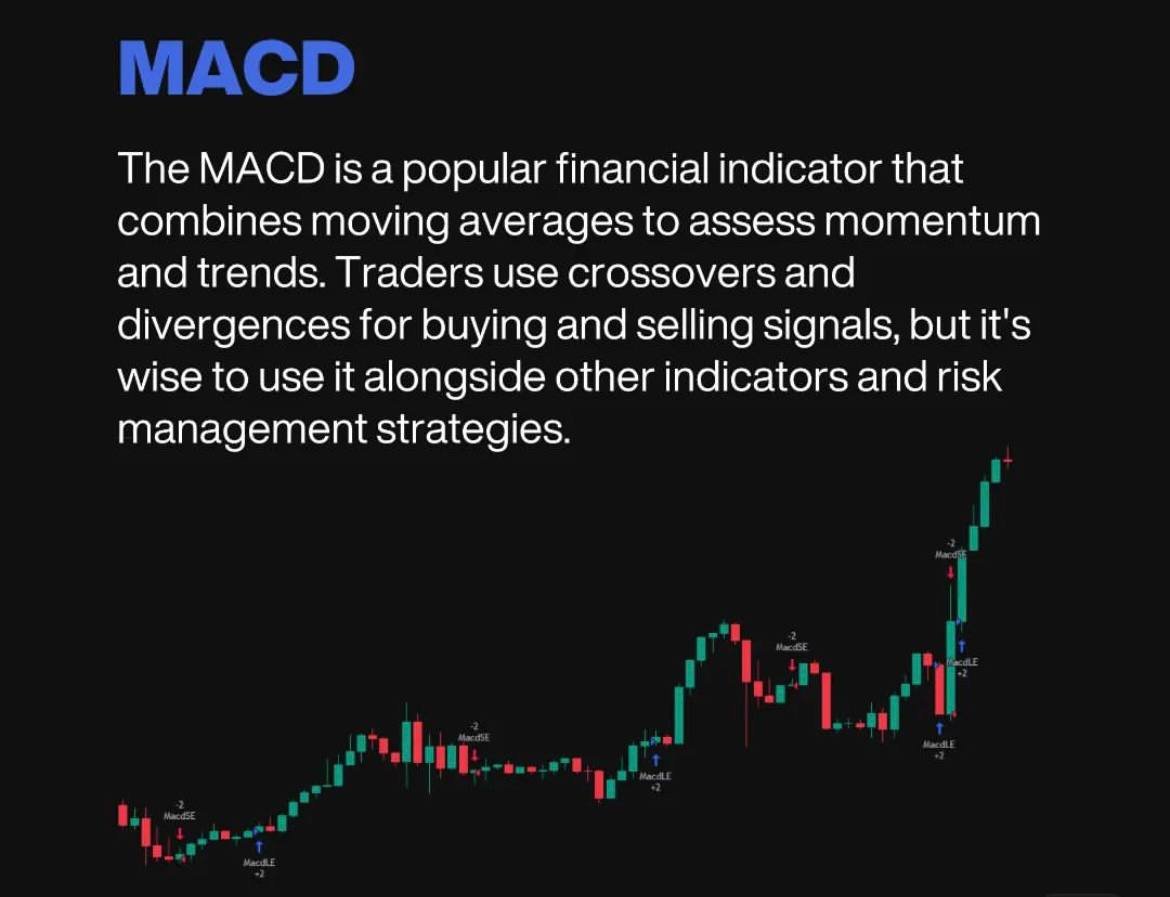
1.1 MACD When the crossing of the MACD line with the Signal line occurs from the bottom up, the trend will be bullish. When the crossing of the MACD line with the Signal line occurs from top to bottom, the trend will be bearish.
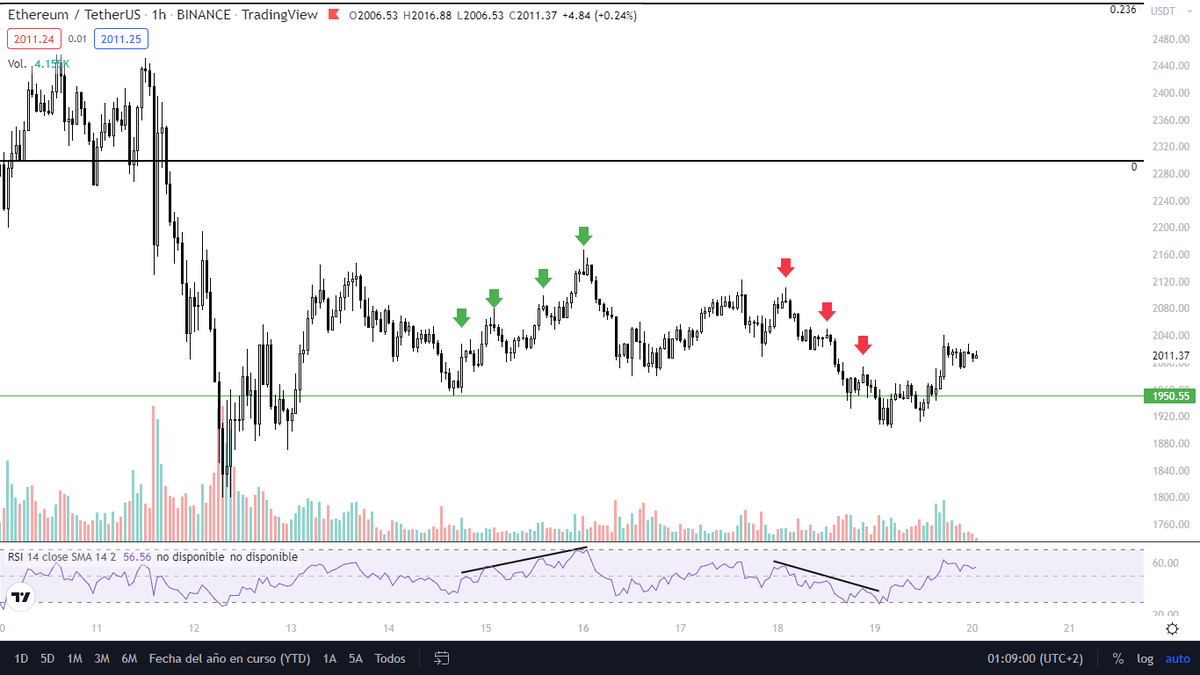
2. RSI RSI is an oscillator that reflects the relative strength, between the uptrend and the downtrend. RSI indicator around level 30: reflects oversold levels RSI indicator around level 70: reflects overbought levels
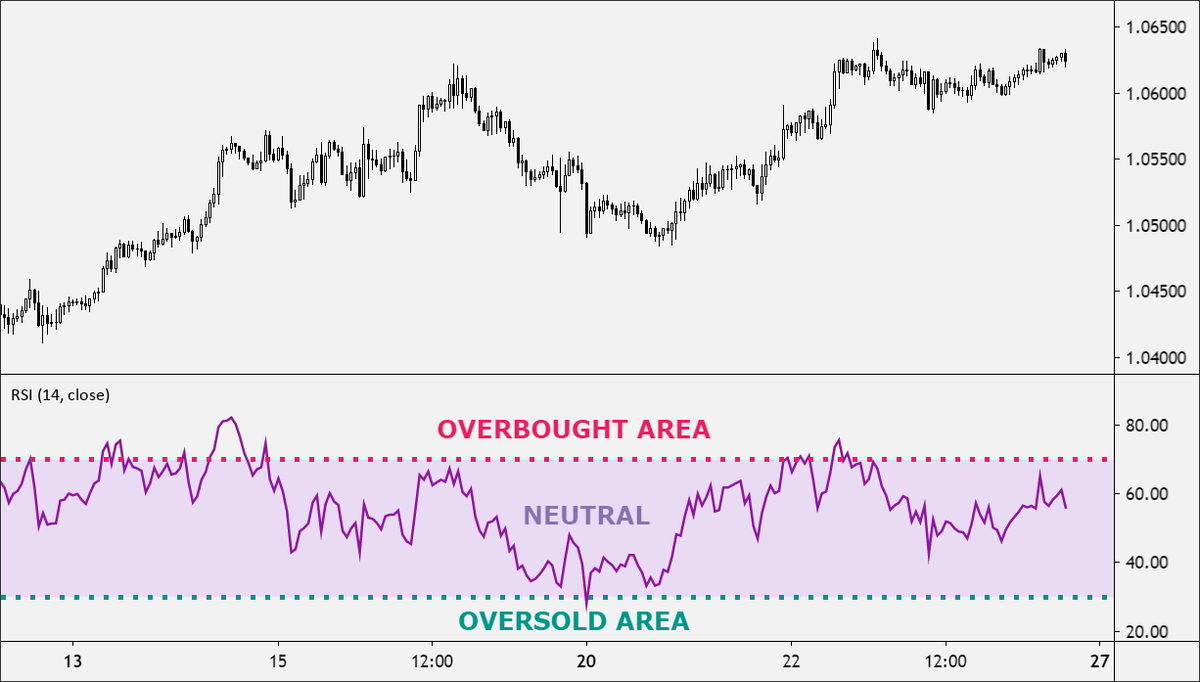
2.2 RSI To draw an uptrend line on the indicator, you need to connect two or three or more peaks of the RSI indicator as HH points appear. On the other hand, a descending line is drawn by connecting three or more peaks as the points descend.
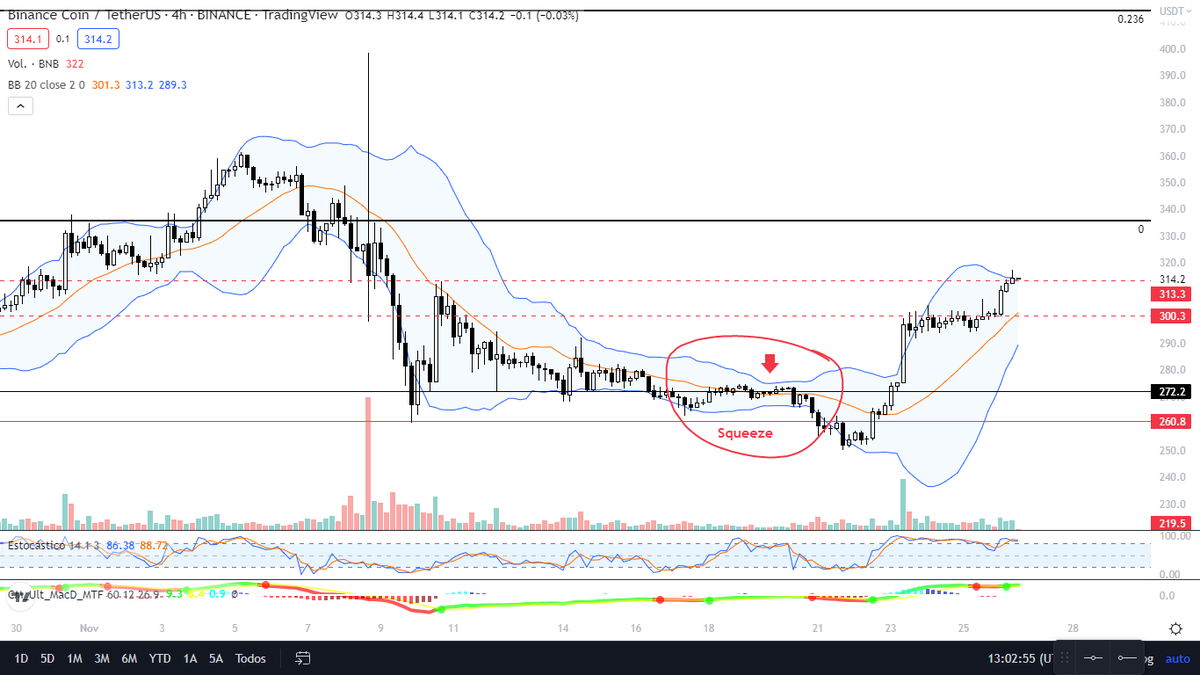
3. Bollinger Bands Bollinger bands are one of the most widely used trading indicators. Is used to compare the changes in the price value of any asset and the relative value of its price over a period of time.
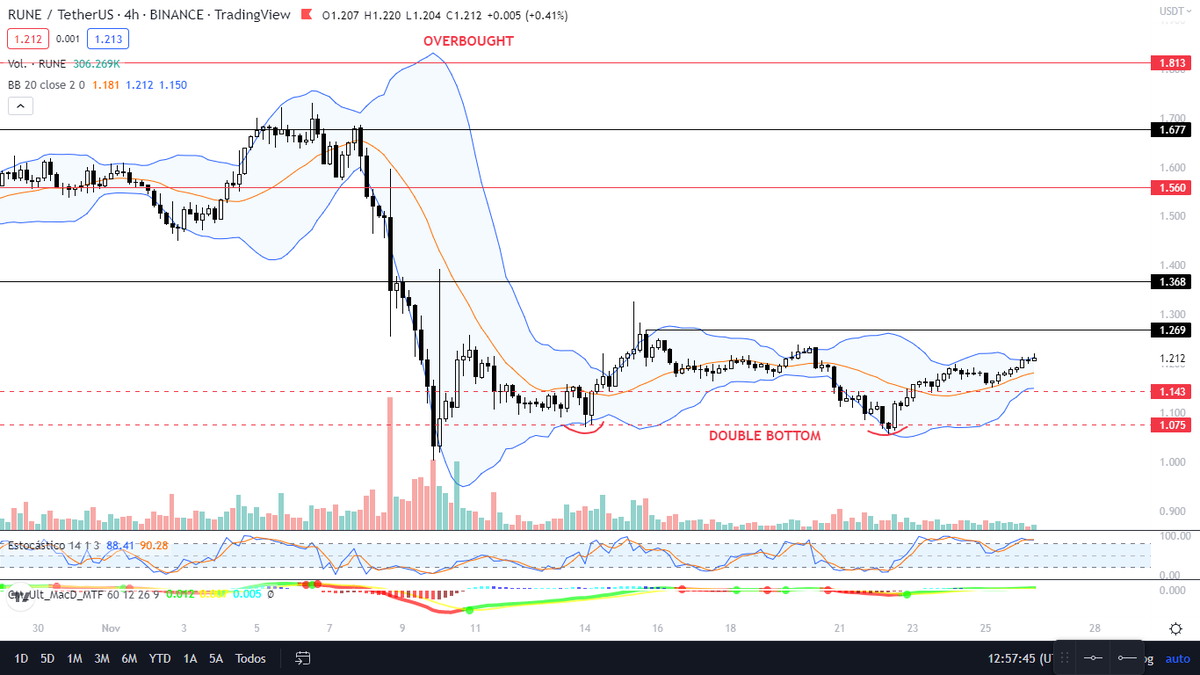
3.1 Bollinger Bands "Squeezing" occurs when the bands taper upward enough that they appear to merge or coincide. If the price converges with the upper band, this indicates a bullish breakout. If the price converges with the lower band, this indicates a bearish breakout.
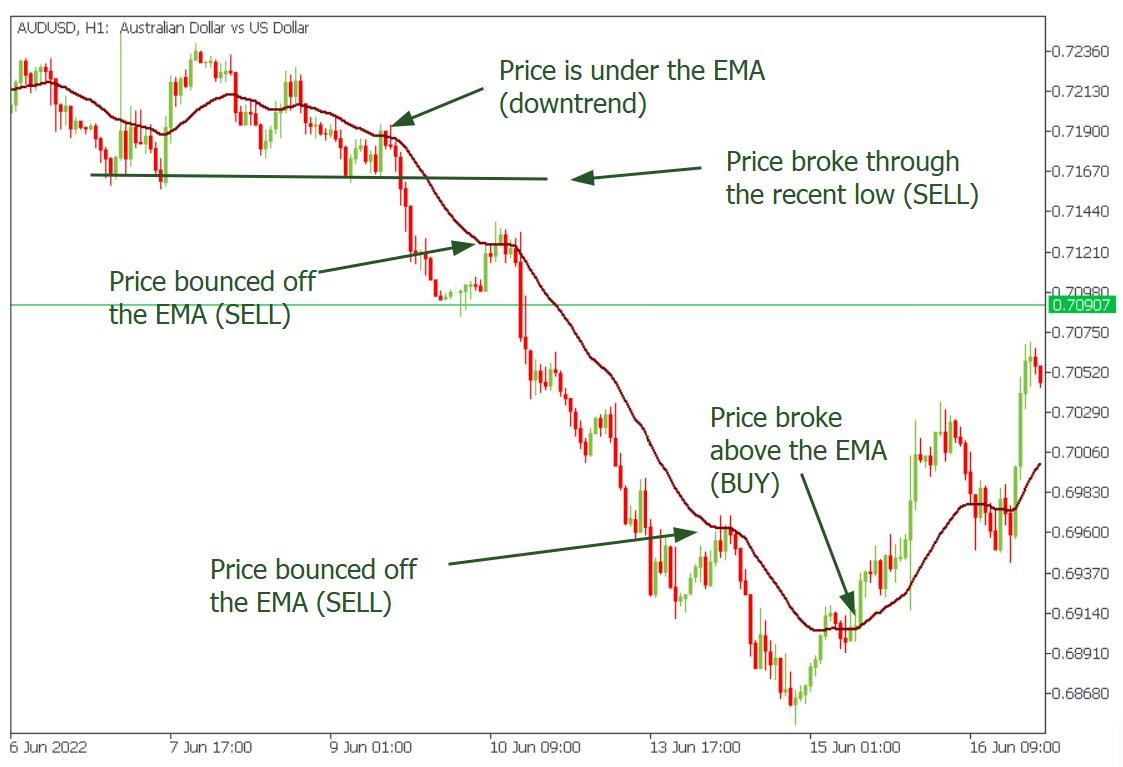
4. EMA The exponential moving average is a weighted moving average that measures a trend, both bullish and bearish. The EMA is used in trading to determine whether the price going up or down. EMA's are also used as Support and Resistance.
5. VWAP Volume-weighted average prices is a technical analysis tool that shows the ratio of an asset's price to its total trade volume. It provides traders and investors with a measure of the average price at which a stock is traded over a given period of time.

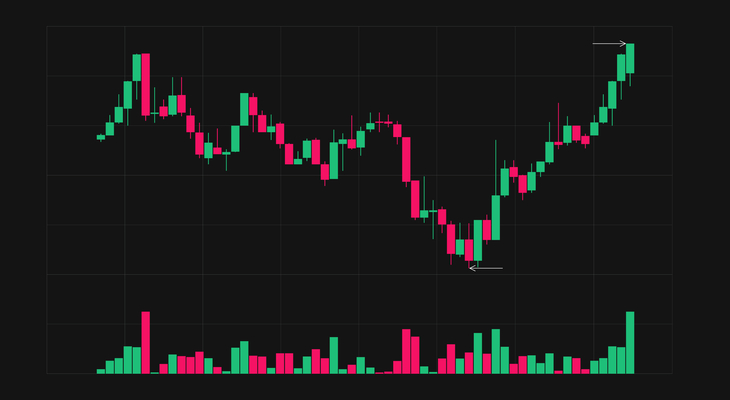
6. Volume The volume of trade is a measure of the market's activity and liquidity during a set period of time. Higher trading volumes are considered more positive than lower trading volumes because they mean more liquidity and better order execution.
@SoulzBTC Your thread is going viral! #TopUnroll https://threadreaderapp.com/th... 🙏🏼@MMst1991 for 🥇unroll
@SoulzBTC Keep it up.
@SoulzBTC tnks for the notes sire.
@SoulzBTC My mentor is back again with great stuff. May you remain blessed
@SoulzBTC Hi bro. Thank you very much from the heart! 👍✍️
@SoulzBTC Thanks for information 👍
@SoulzBTC Thanks 🙏
@SoulzBTC Nice article ❤️❤️❤️❤️
@SoulzBTC Gracias Soulz ya estoy formando mi enciclopedia con tu nombre.
@SoulzBTC Thank you Soulz for your hard work. Very helpful 👌
@SoulzBTC Bro thank u so much 💓
@SoulzBTC Pretty good and useful, thanks, sir! Subscribed!
@SoulzBTC Thank you
@SoulzBTC @threadreaderapp unrolled
@SoulzBTC Interesting. Why not add Ichimoku in the next one ?
@SoulzBTC Bitcoinian helps you setting complex alerts on indicators. check us out
@SoulzBTC Is it advisable to trade these indicators alone?🤔
@SoulzBTC wow so nice, i have learned many
@SoulzBTC Good stuff
@SoulzBTC I feel sorry for those who are reading this thread