Why are the kids scoring poorly today? Uh, high ceilings. This study is making the news, but it is bad🧵

To start, note that multiple outlets have reported that this study provided evidence that the higher the ceiling of the test-taking environment, the lower the exam scores. Thus, 'Your poor performance might not be your fault. It's the fault of the ceilings!'

Spoiler: if you download the data, you find that the correlation is -0.0423. You could say "Oh, the effect is small, but it could matter." But wait a second.
The correlation with the year testing took place is 0.1193, and the one with test-taker age is -0.0870. Did ceiling height influence either? Maybe year influenced ceiling height due to construction, but year also influences scores for common tests (the Flynn effect).
The correlations with gender (0.0042), unit (0.1365), trimester (-0.0476), campus (-0.6034), room assignment (-0.7213), and seat number for the exam (0.2527) were usually greater than the ceiling height x score correlation. Same pattern with Spearman correlations.
This starts off dubious, but let's get to the meat. The headline result is wrong. Maybe. It's really not clear because these authors messed a lot of details up. Let's start with their preanalysis plan, or PAP.
PAPs are great. They give researchers the chance to make studies more credible by letting them explain exactly what they're going to do before they do it, so we know they didn't cheat to get their results. Here's their preregistration + PAP: https://osf.io/c9hf5
They hypothesized larger spaces -> lower exam scores in a non-experimental study. They specified a model with one independent variable one dependent variable, and one covariate. Remember this.
The sampling plan is where things get weird and inconsistent. They state that they haven't looked at the data, including the summary statistics (N's, means, SDs, etc.), but they also claimed to predict a sample size of about 15,000—almost exactly what they ended up with.
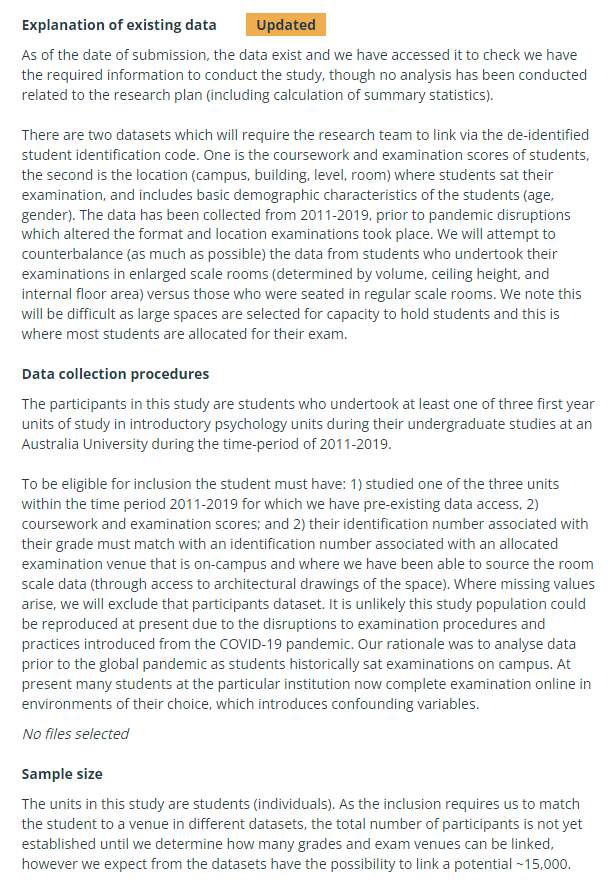
They also said they intend to counterbalance students so that they have relatively equal numbers in different examination environments If this is preexisting data and they're just gathering it all together, how do they do that? You're supposed to only be able to get what's there
The weirdest part is that they... said the study was an experiment. But it's not an experiment. It's not even a natural experiment unless they know something score-related that explains why students were apportioned to rooms of different sizes. Bizarre comment and it gets worse
Regarding the variables, higher exam and course scores = better. They're all scaled out of 100. They're not necessarily comparable between locations, which could introduce bias and error, but whatever, you live with what you have. For now take notice of my highlights.... What?
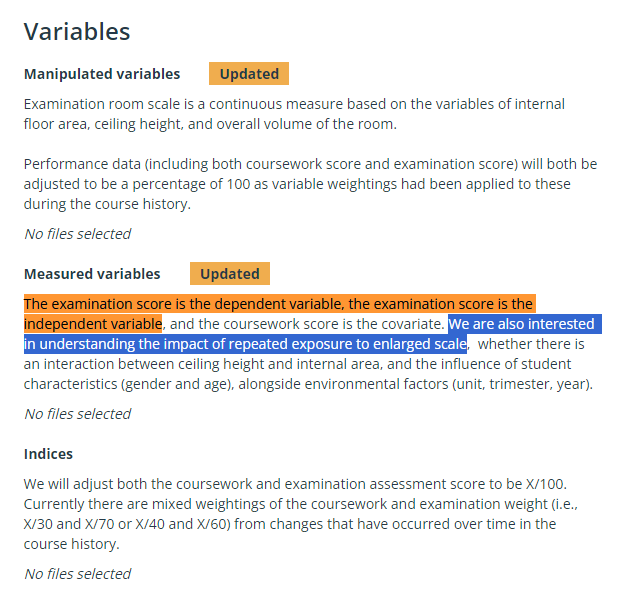
The orange highlight is probably an error. It's weird it's still in there after they corrected the preregistration though. The blue part is... just saying what they want to do, but not what they actually can or did do with the data? Why is this in there?
And here's why this ultimately is a useless preregistration: the PAP contains no detail relevant to what the authors would eventually do with the data. "We will use an LMM" — OK, tell me more about that LMM.
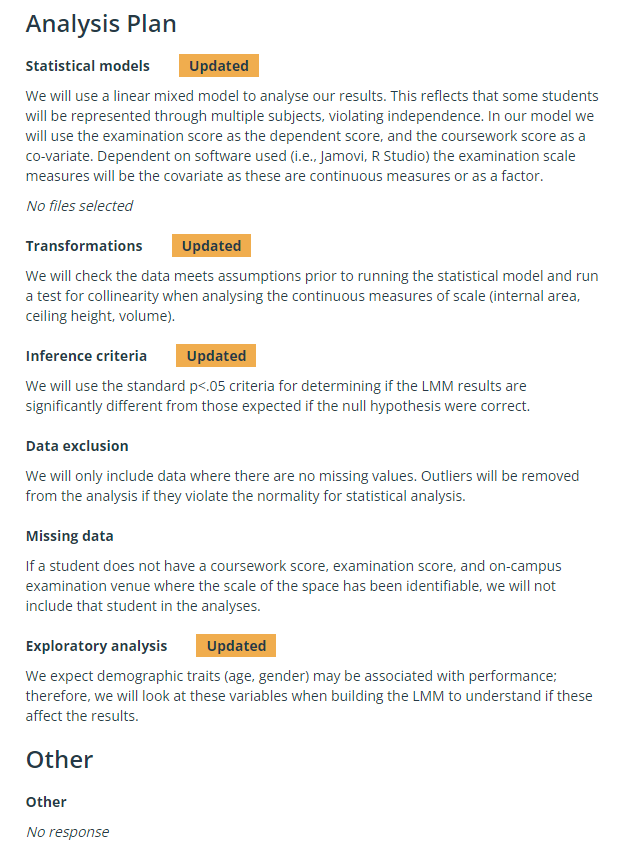
"The LMM reflects..." — hold up, that's a meaningless statement without more model detail. They suggest there's some sort of nesting, but don't detail their plan for it "We will test for collinearity..." — never shown They don't tell us how they want to remove outliers
They don't even know what software they're going to use. If you want to do a good PAP, provide suitable code beforehand. Tell us the packages you plan to use. Do not do this messy nonsense that provides too little detail for an independent analyst to replicate your exact work.
Here's that code: https://osf.io/wmu72. It's written in R. It only includes an LMM fitting and plotting. It doesn't include much else, and the LMM is not what they prespecified they would look at. Here's the whole of the model code:
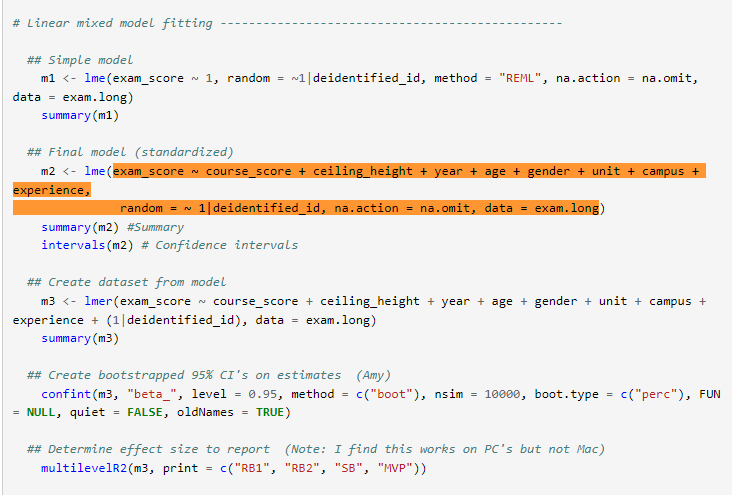
The "simple model" is not really a model. The "Final model (standardized)" is bizarre. It includes things they registered would be considered exploratory, and what's the standardizing? They also then bootstrap the CIs for... no reason. You can get analytic CIs with this!
The only model we're treated to in the whole paper is this "Final model (standardized)", which is not standardized. The betas are obviously unstandardized, but let's ignore that I can confirm these are the 'correct' coefficients from this final model, but look at ceiling height:
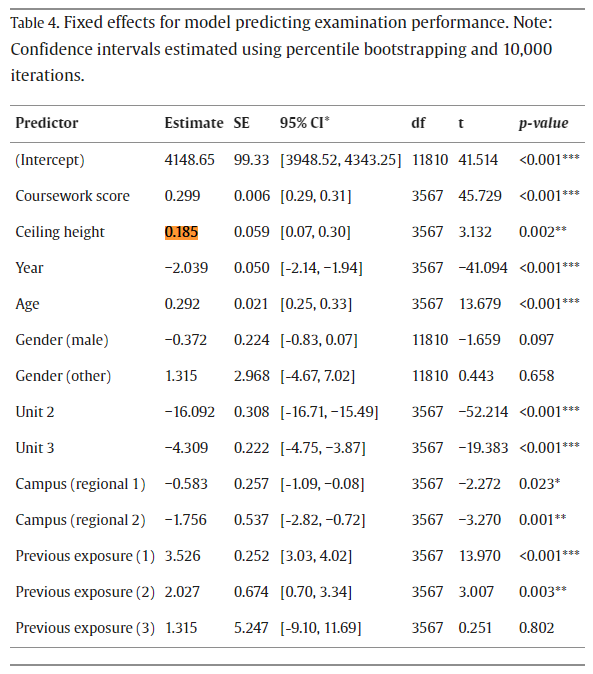
You're seeing that right. It's not mislabeled. The coefficient was positive 0.185. In other words, higher ceilings were associated with higher scores! The study then goes right into the Discussion, where it says... higher ceilings bad!
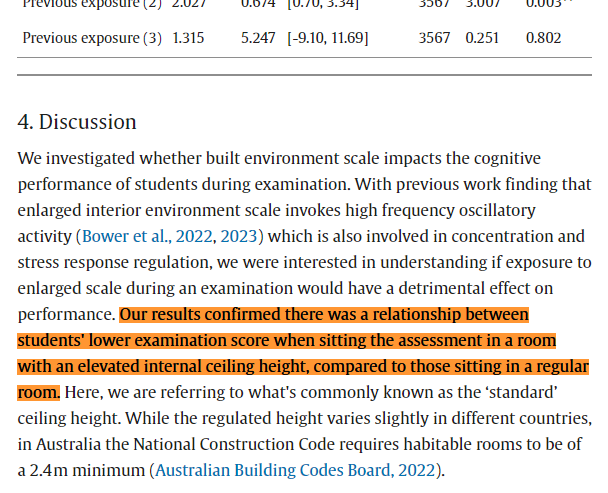
Where is this coming from? It's not in their plots, nor in their models, and they even omitted the very small but negative cross-sectional ceiling height by test score correlation from their correlation matrix in the paper. They concluded the OPPOSITE of what they found!
But if they had stuck to and reported their registered model with its single covariate, no stated random effects (i.e., fixed effects) without exploratory analyses, they would've found a highly significant negative effect of ceiling height on test scores.
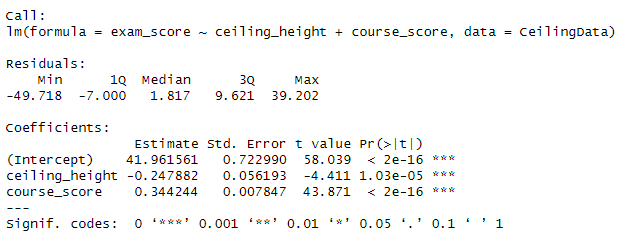
This too is probably wrong. The individual fixed effects shouldn't have been specified because we're only seeing most of these people once, in the presence of considerable confounding. Remember those high correlations between ceiling heights and other variables I mentioned?
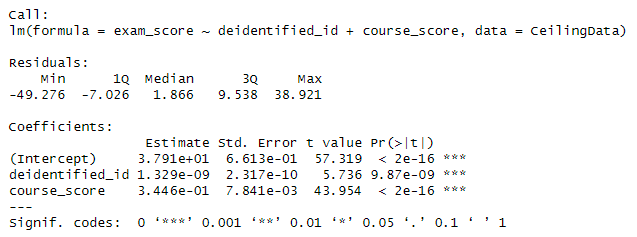
The correlation between ceiling heights and test scores at the heart of this study was -0.0423. The correlation between exam scores and students' IDs was an even more larger 0.0473. Theoretically, IDs should not be correlated with anything in the data. And yet, they were.
Just to check, if we refit the preregistered specification with IDs as the predictor instead of ceiling height, they hold up even better. This is for a variable that should be random! There's clearly confounding afoot, and this design can't handle that.
Now, I don't want this to go on forever, so I'll state that - There are probably issues with measurement invariance. People took different tests, at different places, in different times, with several thousand people taking it for their nth times.
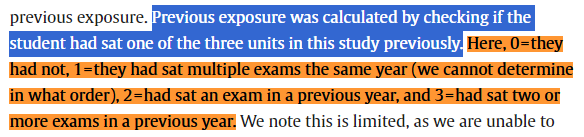
- Some of the variables are badly defined. For example, prior experience is pic-related and it was specified quantitatively. - There's more, but I'll go onto the real result.
Because things like campus and trimester of course-taking seem to matter so much, we absolutely should control for them. When we do, p on ceiling height goes to 0.02 — highly unconvincing — and the coefficient is in the wrong direction.
Additionally, if we drop "Year", it goes to 0.272. The last part is important. With comparable samples, courses, and scores, that shouldn't have happened. Incomparability confirmed. So, OK, how would we do this right?
1. Use a within-person design 2. Deal with nonlinearity The way we do #1 is by looking at repeaters and controlling for their earlier scores. Simple enough! But has a small, select sample.
#2 is also super important. This study is not specified with a nonlinear term for ceiling height. If we take that seriously, optimal performance should be in a cave or at the bottom of a space elevator.