
Kumo (Cloud) [Ichimoku Thread #7 🧵👇]

1/14 🇯🇵Japanese name: Kumo 🇬🇧🇺🇸🇨🇦🇦🇺English name: Cloud ➡️Meaning: Kumo is the area between SSA and SSB.

2/14 Price relation to kumo 💪📈The further the price from the kumo, the stronger the trend. 🐂 Price above the cloud is in a bullish territory (but not necessarily in a bullish trend). 🐼 Price below the cloud is in a bearish territory (but not necessarily in a bearish

3/14 ☁️🌪️Price inside the cloud is in neutral territory and there it enters a storm/tsunami mode which is very spiky and unpredictable. Every rule has its exceptions but as a rule of a thumb, the cloud is a no trade zone. Until the price leaves the cloud with a clean breakout

4/14 If you don't trade when: 1⃣The price is is in the daily kumo 2⃣LTF/MTF haven't covered the Ichimoku conditions for filtering fakeouts (more on that in futher lessons) 3⃣ADX is below 20 (Average Directional Index, different indicator from Ichimoku) then you will protect
5/14 Once the price leaves the kumo, it often starts to accelerate. The reason for this is that SSB, the strongest and last support/resistance line has been overcome. That being said, not each kumo breakout is real. There are other factors to consider like the way in which
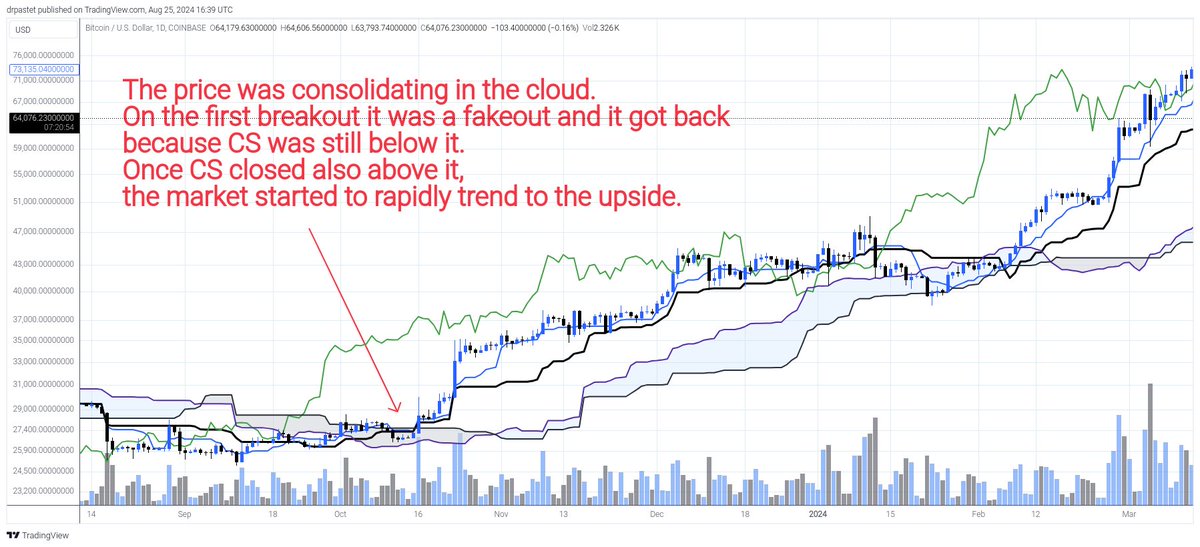
6/14 🚦 Signals: Kumo twist When SSA crosses above SSB (which is a golden cross, or a death cross if the opposite) this is a sign that buyers/sellers are in control long term. This is the "big cross" in Ichimoku as opposed to the TK cross which reflects the short and mid term

7/14 Kumo thickness B) Kumo (the kumo is printed in the future) Thick kumo means sustained trend. Thin kumo means unsustainable trend and a danger of a retrace. In practice, in crypto this is not always the case though, because crypto is too volatile and often ignores retrace
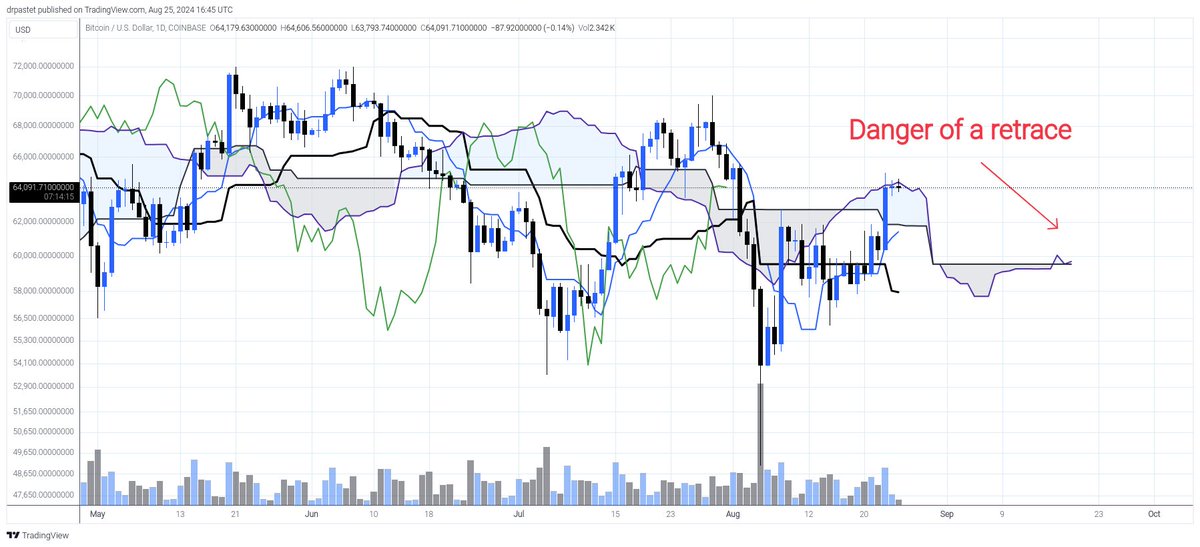
8/14 A) Current kumo (at the current price, 26 candles later after being printed already). The thicker the current kumo, the strongest the support/resistance and the harder it's to get penetrated/crossed by the price.

9/14 All further kumo traits refer only to the future kumo. Kumo color 🟩Green kumo (light blue on my charts) means SSA over SSB and bullish long-term bias. 🟥Red kumo (gray on my charts) means the opposite.
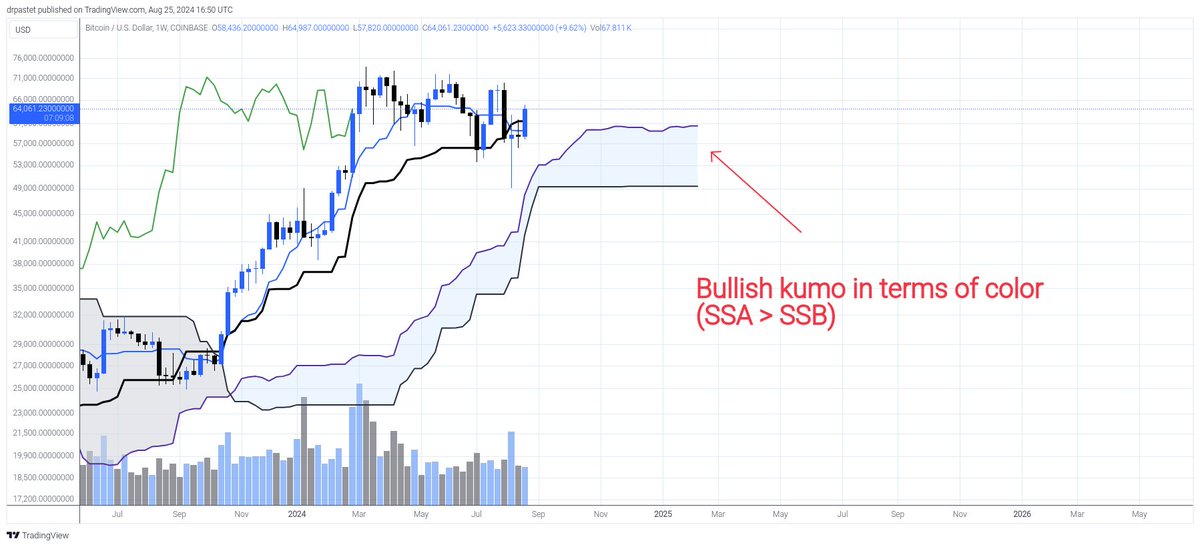
10/14 🐍 Kumo length If the kumo has recently changed its color (has done a recent kumo twist just a couple of candles ago), we need to be cautious before trusting the new trend. Longer kumo gives more credibility to the new trend.

11/14 🎢 Kumo slope 📈On an active trend the kumo is trending in the direction of the trend. 📈📉Flat kumo means range.

12/14 One unique characteristic of the kumo is that it shows the exact support/resistance levels candle by candle 26 candles in the future. And as opposed to MAs, the difference in these S/R levels may be huge and may sharply change. This works extremely accurately thanks to

13/14 Previous lessons 1. The Ichimoku TA system https://x.com/drpastet/status/... 2. Tenkan Sen https://x.com/drpastet/status/... 3. Kijun Sen https://x.com/drpastet/status/... 4. Real and fake TK crosses https://x.com/drpastet/status/... 5. SSA https://x.com/drpastet/status/... 6. SSB https://x.com/drpastet/status/... https://x.com/drpastet/status/...

14/14 If you found this thread useful it could be great to like and share the original tweet at the top. I don't sell anything, I just share my knowledge for free. I don't have a lot of followers so if you think this knowledge is worth it you can help it reach more people.

@drpastet Thank you! Eager to read your further educational content! ❤️
@drpastet AMAZING as always! Thank you for all you do 🙏
@DoctorCatX @threadreaderapp unroll
@DoctorCatX @threadreaderapp unroll