
Tired of watching others profit while you sit on the sidelines? 💰 Introducing Trading 101 A new content segment/thread designed to empower you with the knowledge and skills you need to succeed in the world of trading. Let's dive in together! 📈📚 ⬇️⬇️⬇️

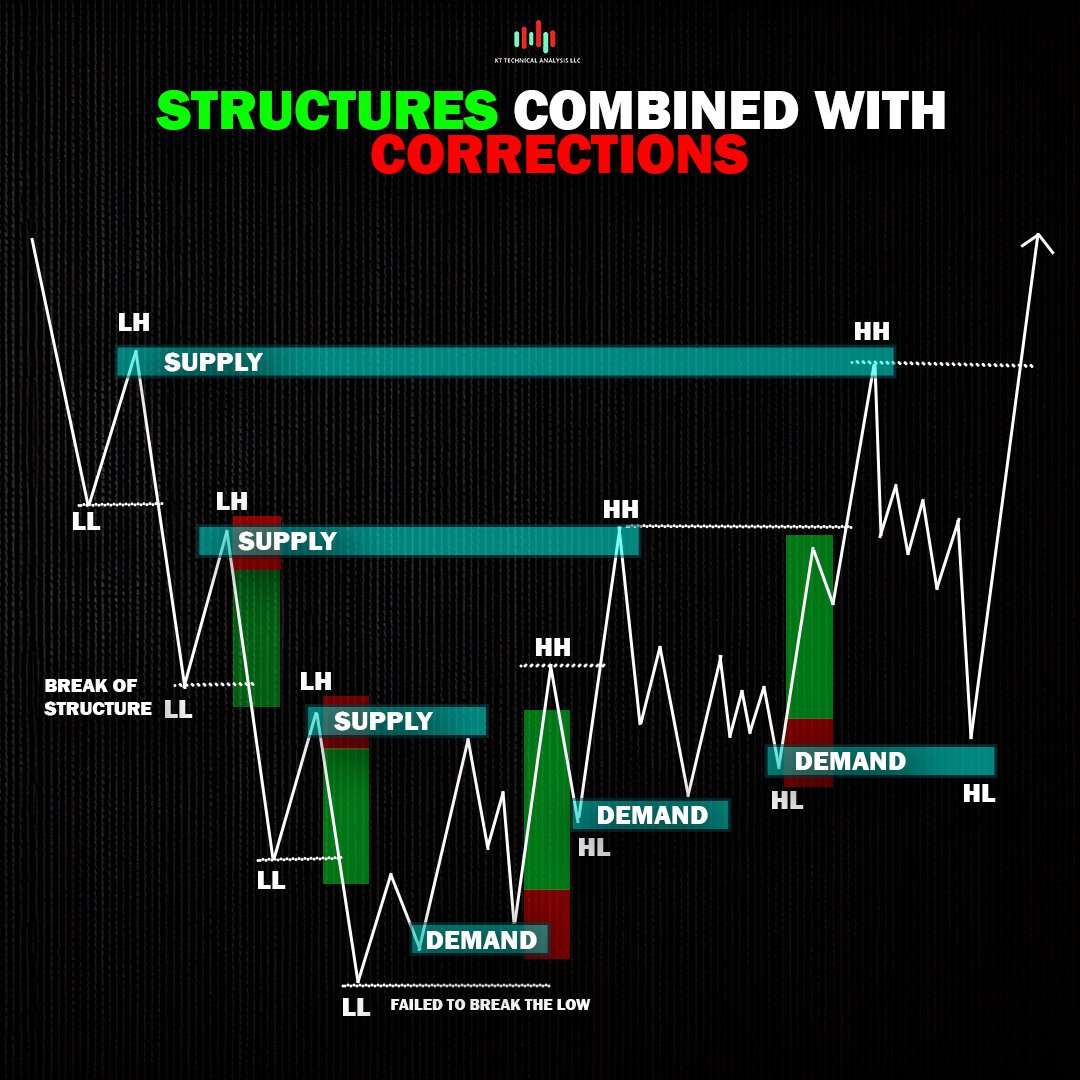
Trading 101: Structures Combined with Corrections💥 This chart illustrates how identifying key supply and demand zones can help you anticipate market movements and capitalize on profitable trading opportunities. 💡 Notice how the price repeatedly tests these zones, creating
Trading 101: Volume Analysis 📈 Volume analysis is a powerful tool for understanding market sentiment and identifying potential trading opportunities. This chart illustrates three different volume scenarios: a volume spike with a weak trend, average volume with an okayish

Trading 101: The Trading Cup and Handle Pattern Is a powerful reversal formation that signals a potential uptrend after a downtrend. The round cup indicates a period of consolidation, where buyers and sellers are battling for control. The handle is a subsequent downtrend

Trading 101: Strong Reversal Patterns These patterns, including the double top, head and shoulders, rising wedge, double bottom, inverse head and shoulders, and falling wedge, signal potential changes in market trends. By identifying and understanding these patterns, you can

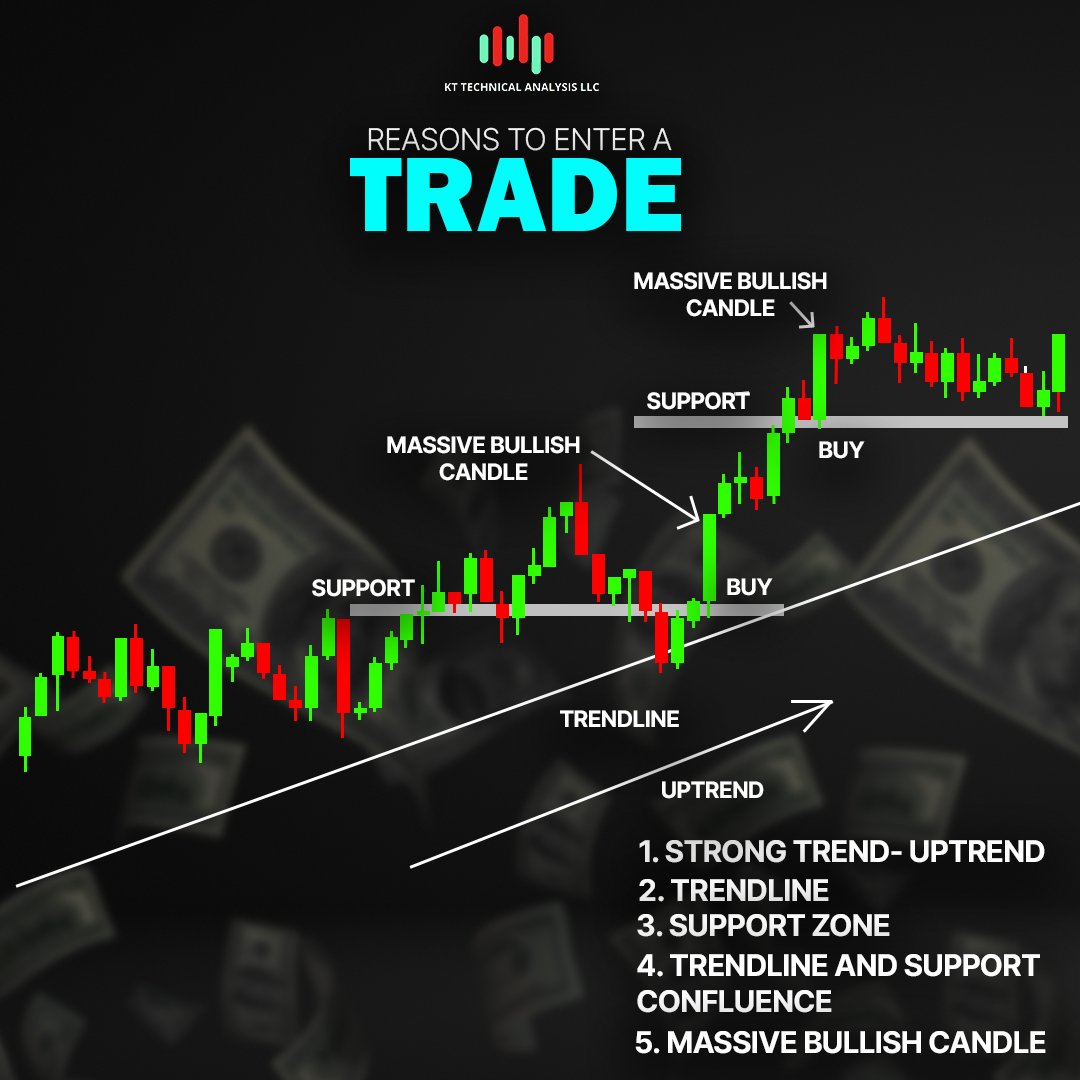
Trading 101: Reasons to Enter a Trade This chart outlines the key factors to consider when deciding to enter a trade: ✔️a strong uptrend ✔️a supportive trendline ✔️a supportive zone ✔️a confluence of these factors A massive bullish candle can confirm the strength of the
Trading 101: Pullback on Resistance Mastering the art of pullbacks on resistance is a valuable skill for any trader. When a price pulls back to a previous resistance level, it can create a potential buying opportunity. A bullish engulfing pattern after a pullback can signal a

Trading 101: 3 Ironclad Rule The three essential rules of Elliott Wave theory are key for analyzing market trends and identifying trading opportunities. Rule 1 states that Wave 3 should not be the shortest among Waves 1, 3, and 5, as Wave 3 is typically the strongest in an

Trading 101: Importance of Risk Management Playing safe? Well, risk management isn’t sexy, but it’s the only way to survive. By understanding and implementing effective risk-reward ratios, you can protect your capital and increase your chances of long-term profitability. The

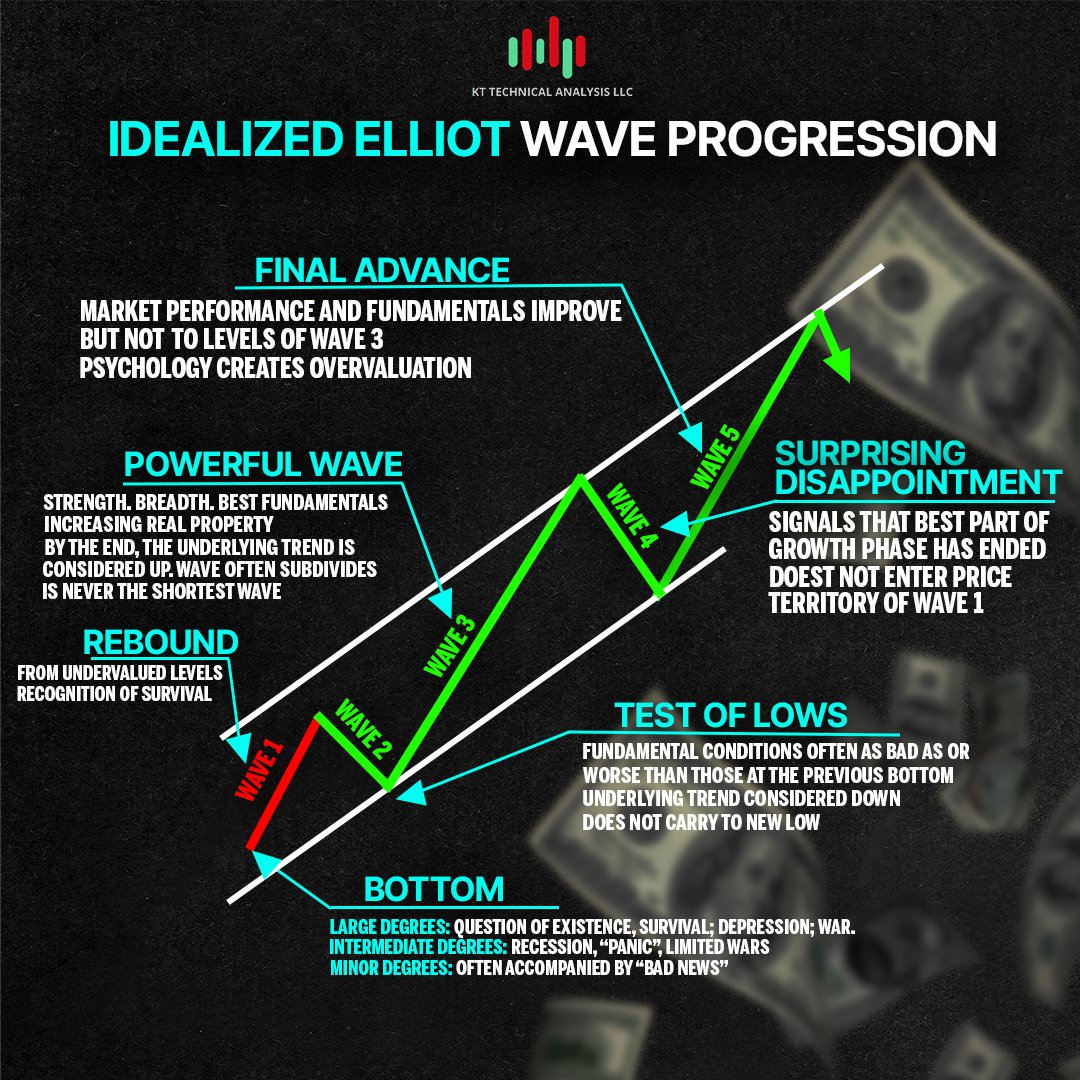
Trading 101: Idealized Elliot Wave Progression This illustration provides a visual representation of the typical structure of an Elliott Wave pattern. Starting with a Bottom, the market enters an Impulse Wave characterized by increasing strength, breadth, and fundamentals.
Trading 101: Elliot Wave Impulsive Wave Structure Trading Strategy The image illustrates the two main types of Elliott Wave Impulsive Waves: Impulse and Diagonal. In an impulse wave (left), Wave 3 is typically the strongest, and Wave 4 should not overlap with Wave 1, ensuring

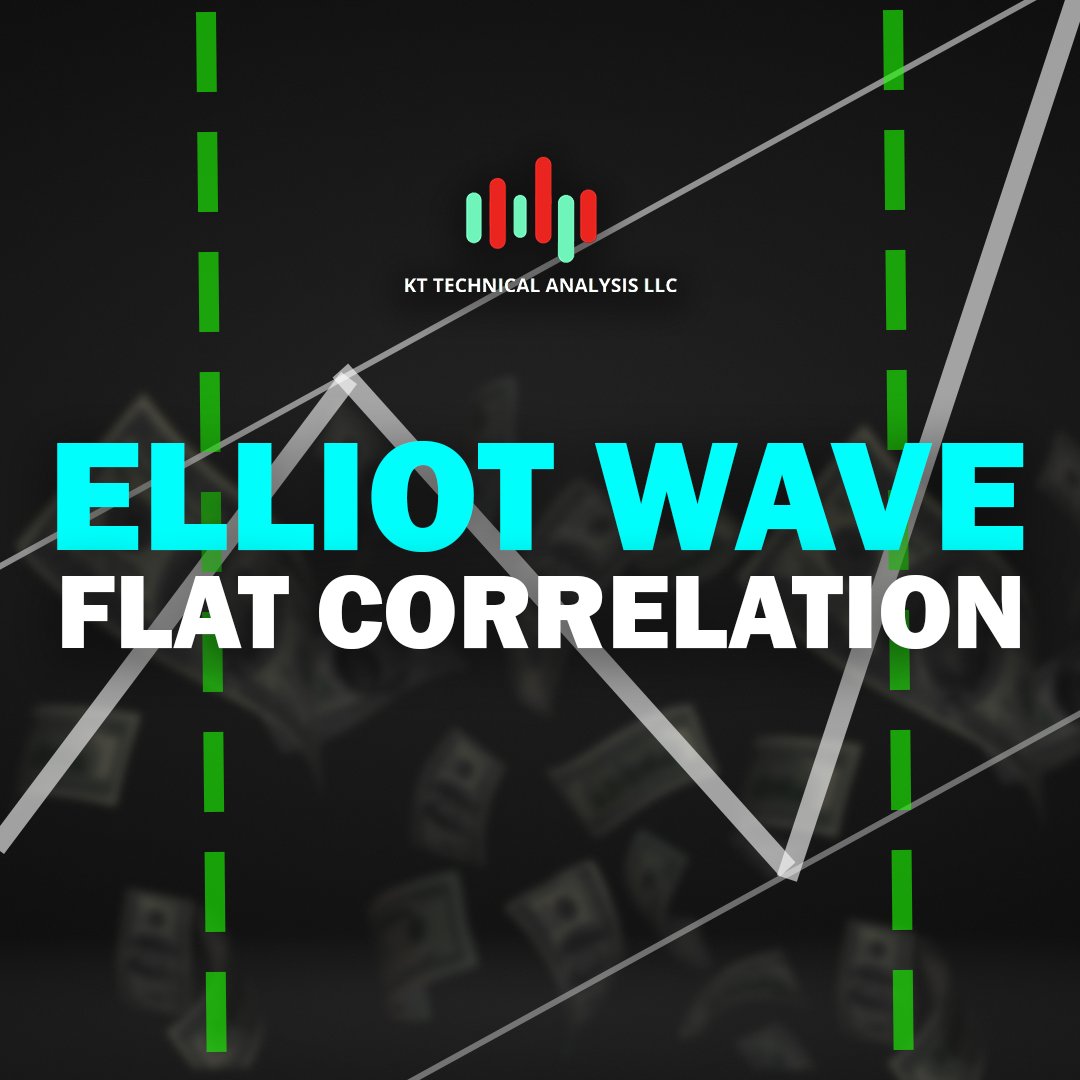
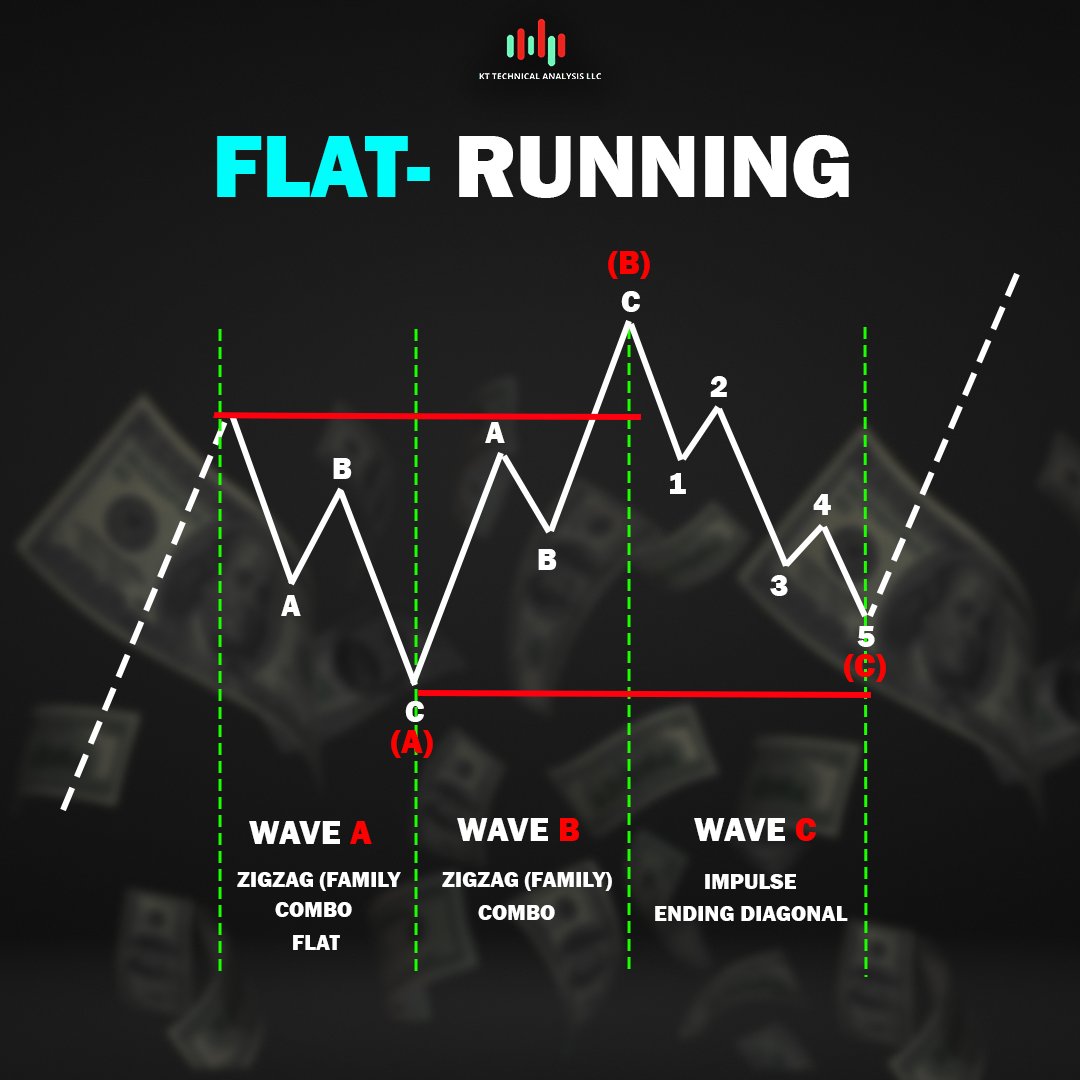
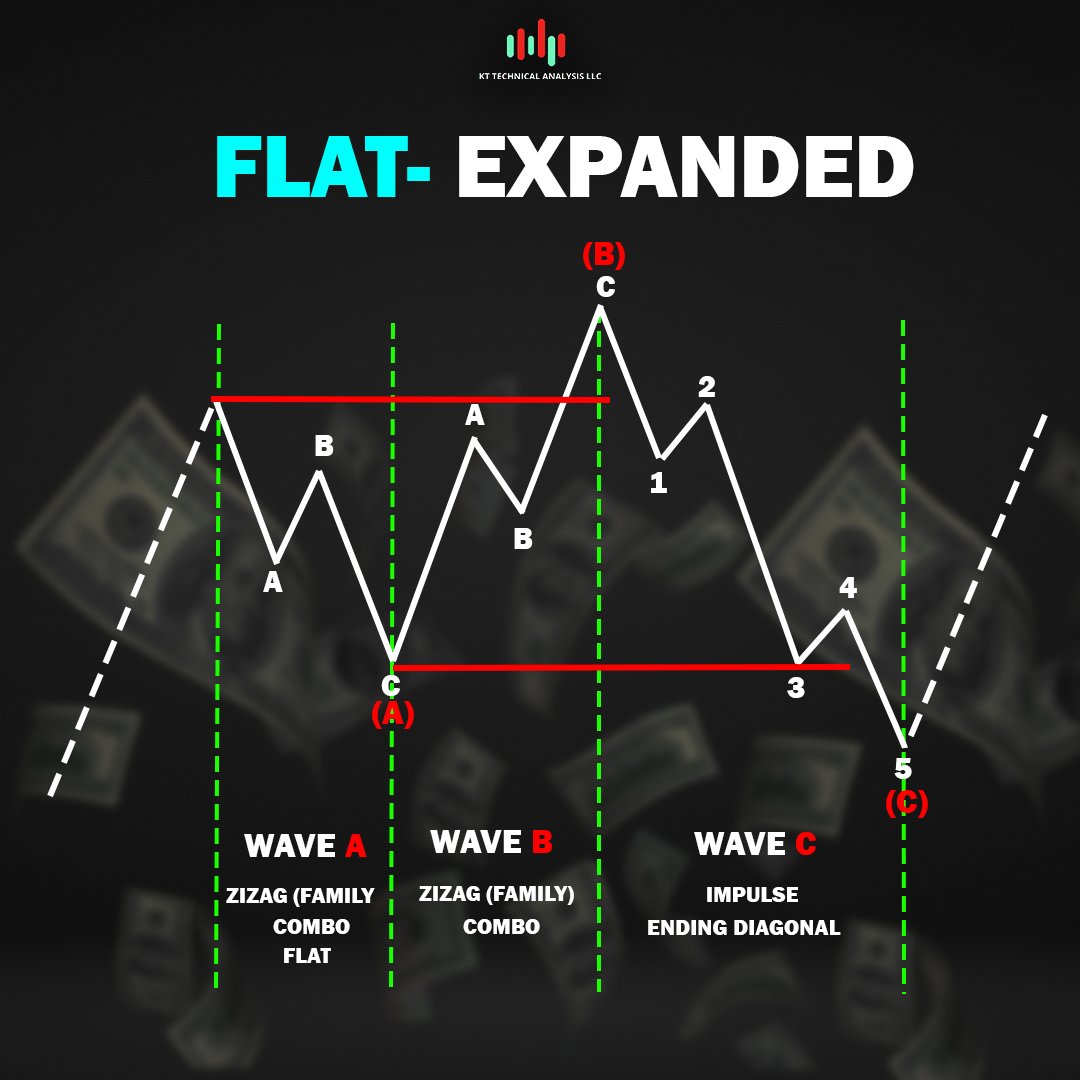
Trading 101: Elliot Wave Flat Correlation This illustration provides you knowledge to identify and trade them effectively. Key for recognizing potential reversals and breakouts. The Flat-Regular pattern is a three-wave corrective structure with a sideways movement, where Wave

Trading 101: Elliot Wave Anatomy The image showcases the fundamental structure of Elliott Wave analysis, highlighting the Rally Phase and Pullback Phase. The Rally Phase is characterized by a series of impulsive waves (1, 3, 5) that drive the market in a particular direction.

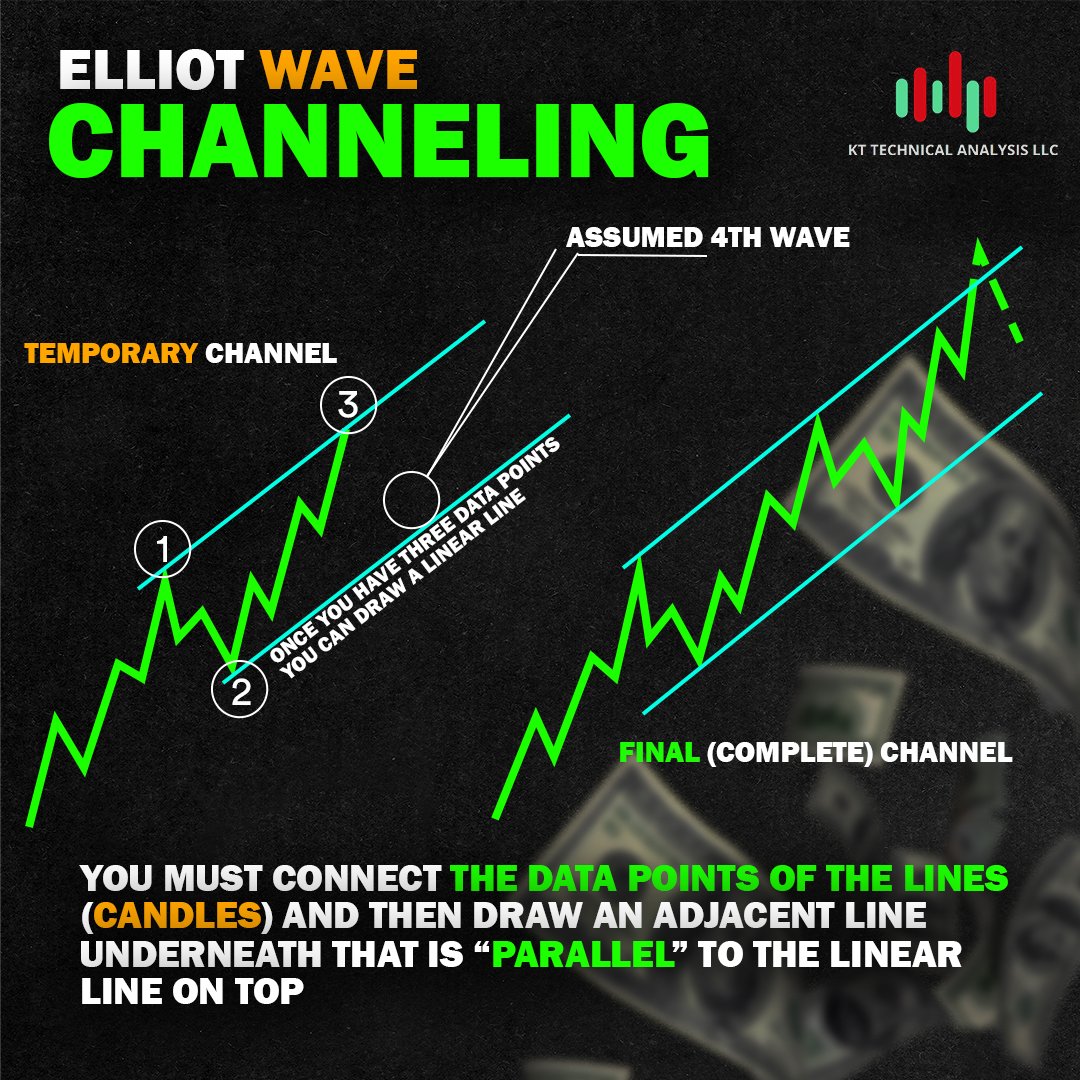
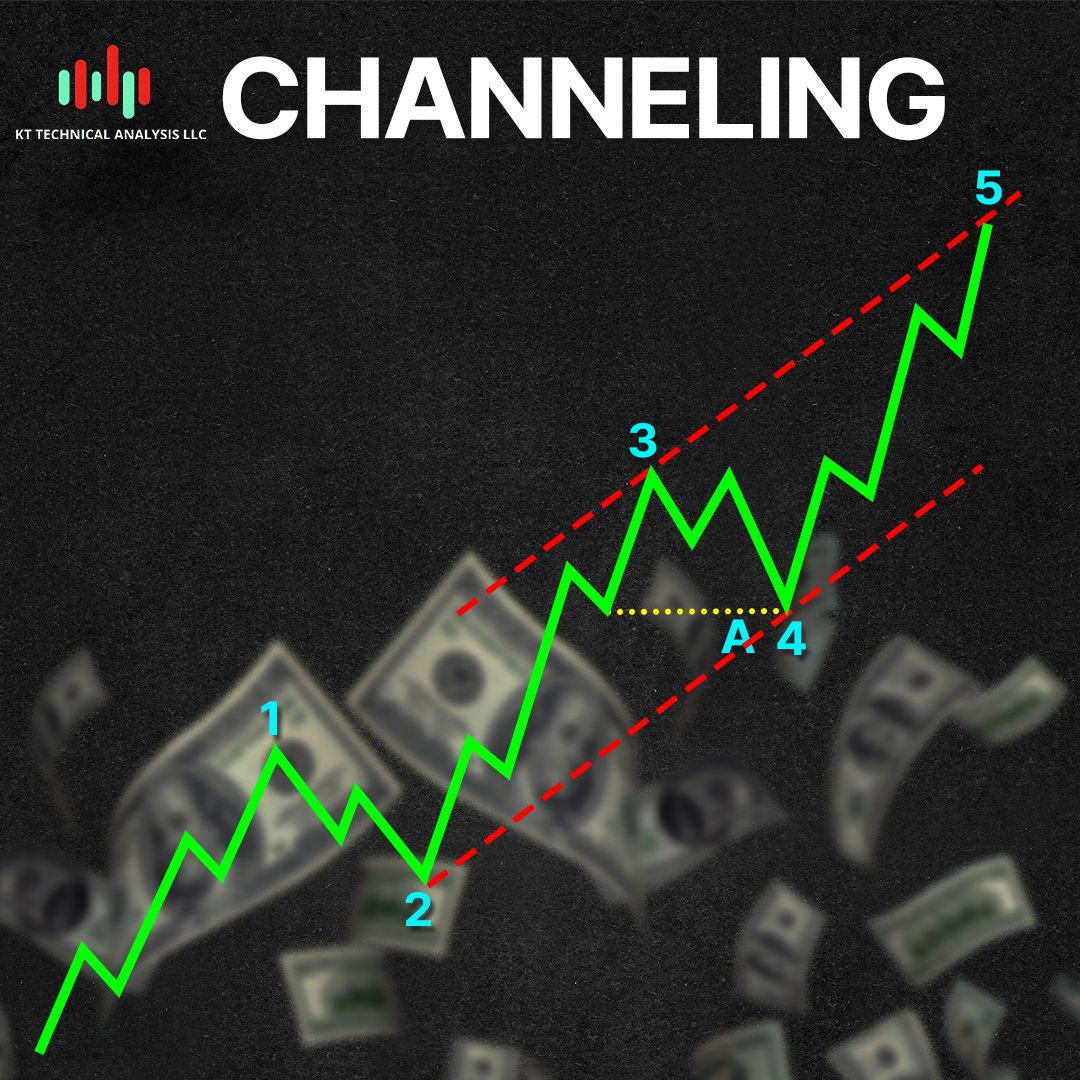
Trading 101: Elliot Wave Channeling The illustrates the process of drawing Elliott Wave channels, a valuable tool for identifying potential support and resistance levels. By connecting the data points of the lines (candles), you can create a temporary channel. Once you have
Trading 101: Elliot Wave Motive and Corrective The image illustrates the key components of Elliott Wave analysis, showcasing the distinction between motive and corrective waves. Motive Waves (1, 3, 5) drive the overall trend While Corrective Waves (2, 4, A, B, C) provide

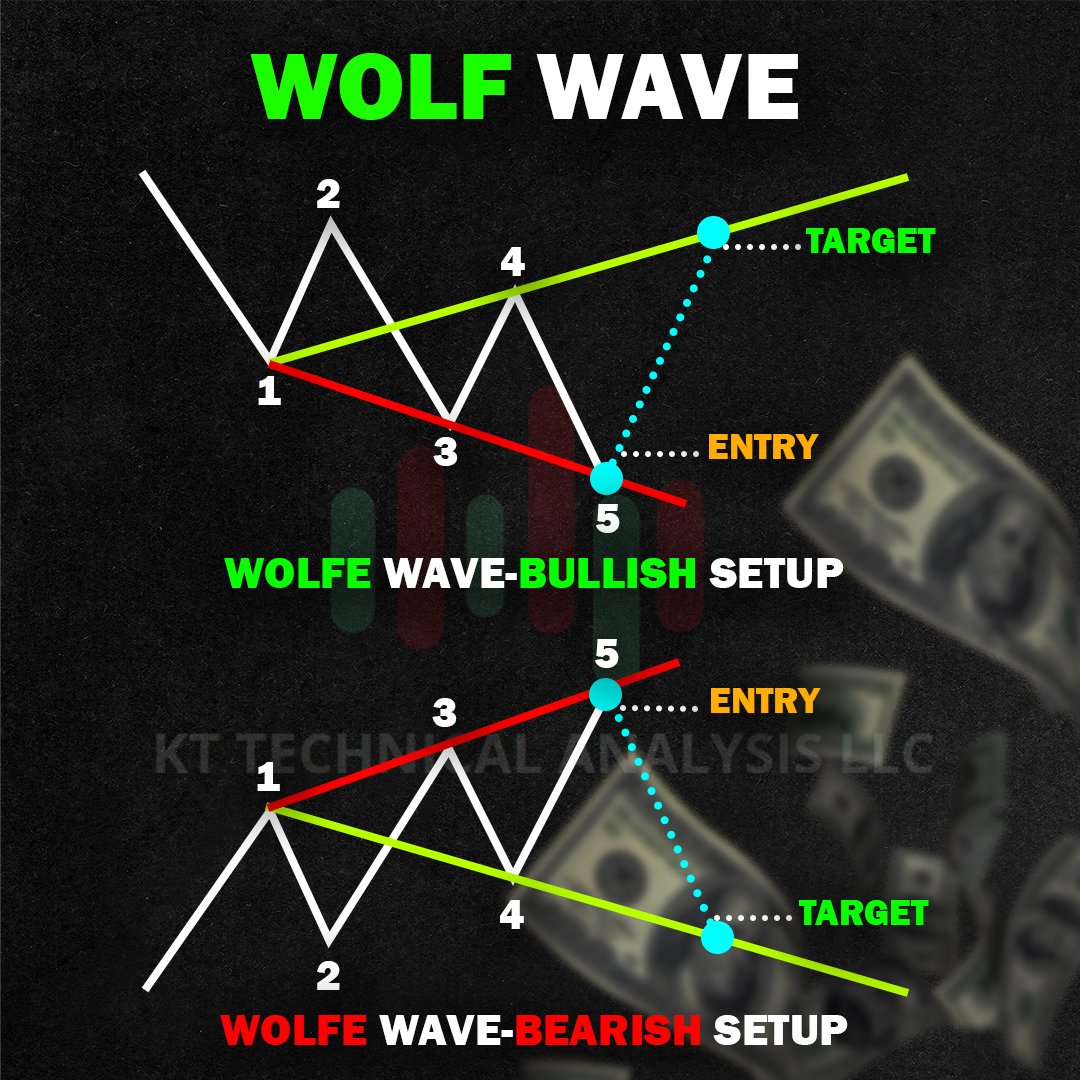
Trading 101: Elliot Wave Wolf Wave This illustrates the Wolfe Wave pattern, a powerful technical analysis tool used to identify potential reversal points. In a bullish setup, Wave 1 is a downward impulse Wave 2 is a corrective pullback Wave 3 is a higher impulse Wave 4 is a
Trading 101: Symmetrical Waves Understand the intricacies of the Contracting Symmetrical Triangle pattern and Ascending Symmetrical Triangle Contracting Symmertrical Is characterized by converging trendlines that form a symmetrical triangle shape, indicating a period of


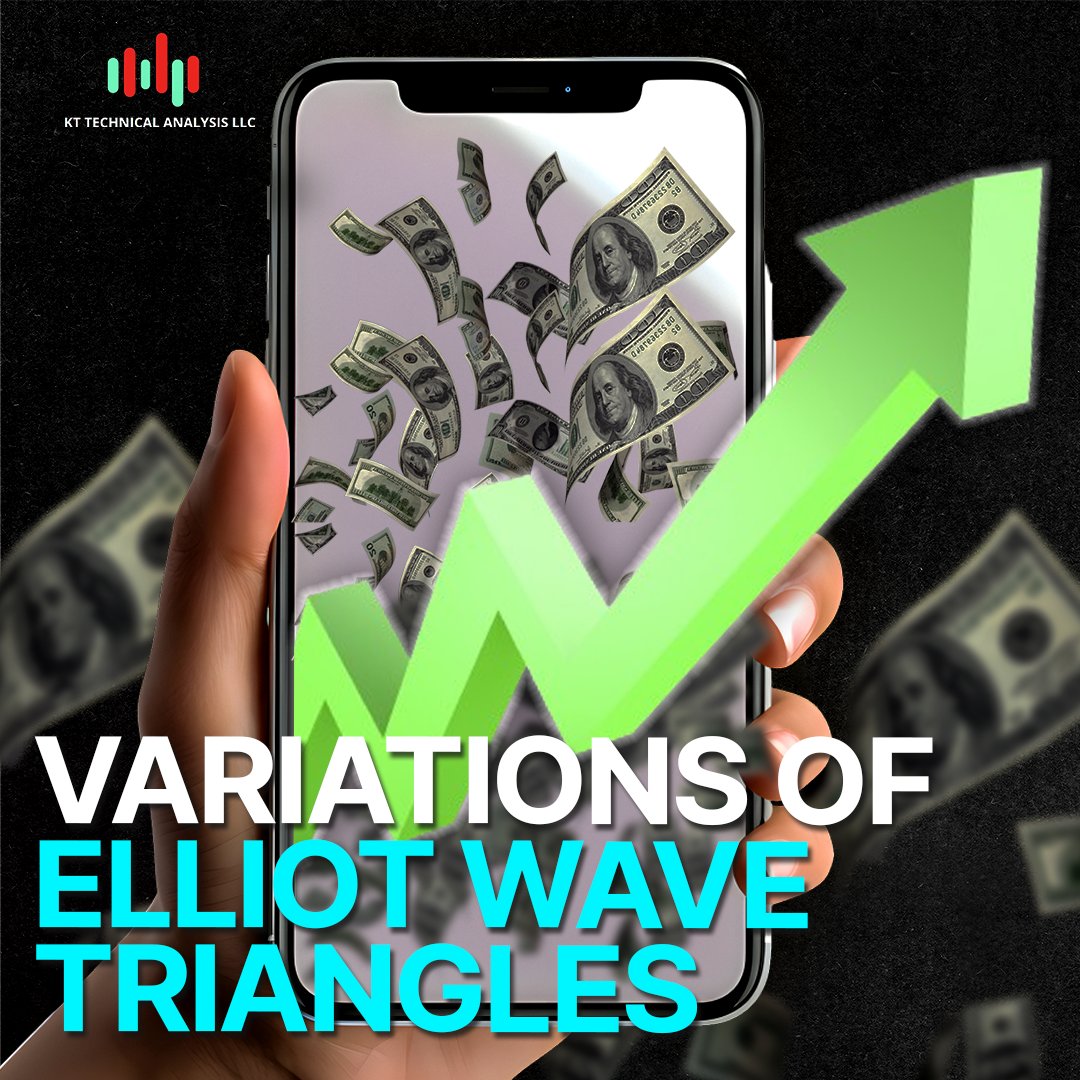
Trading 101: Variations of Elliot Wave Triangles This visual guide will equip you with the knowledge to recognize Contracting, Expanding, and Barrier patterns and make informed trading decisions. Contracting In both markets share the characteristic of converging trend lines,


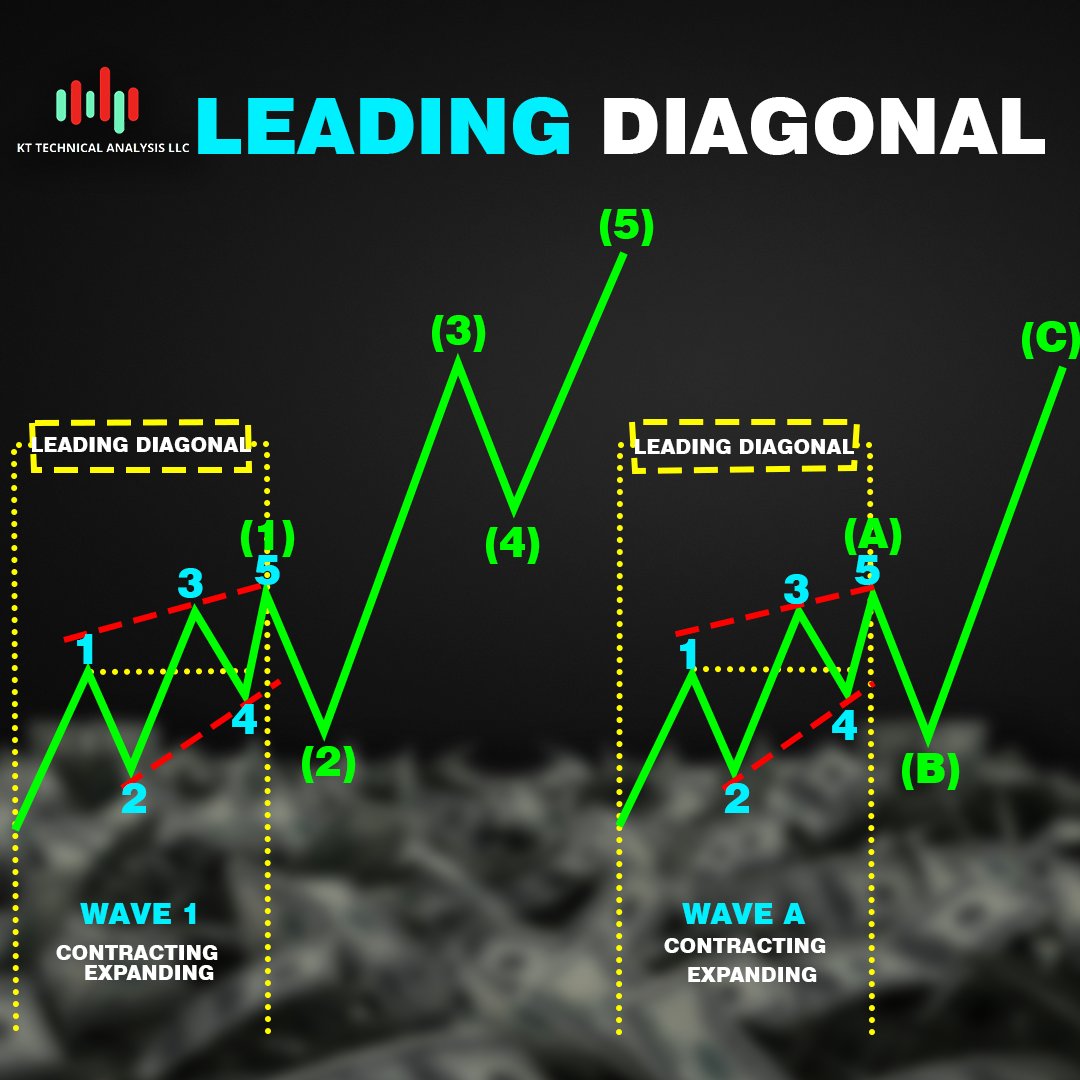
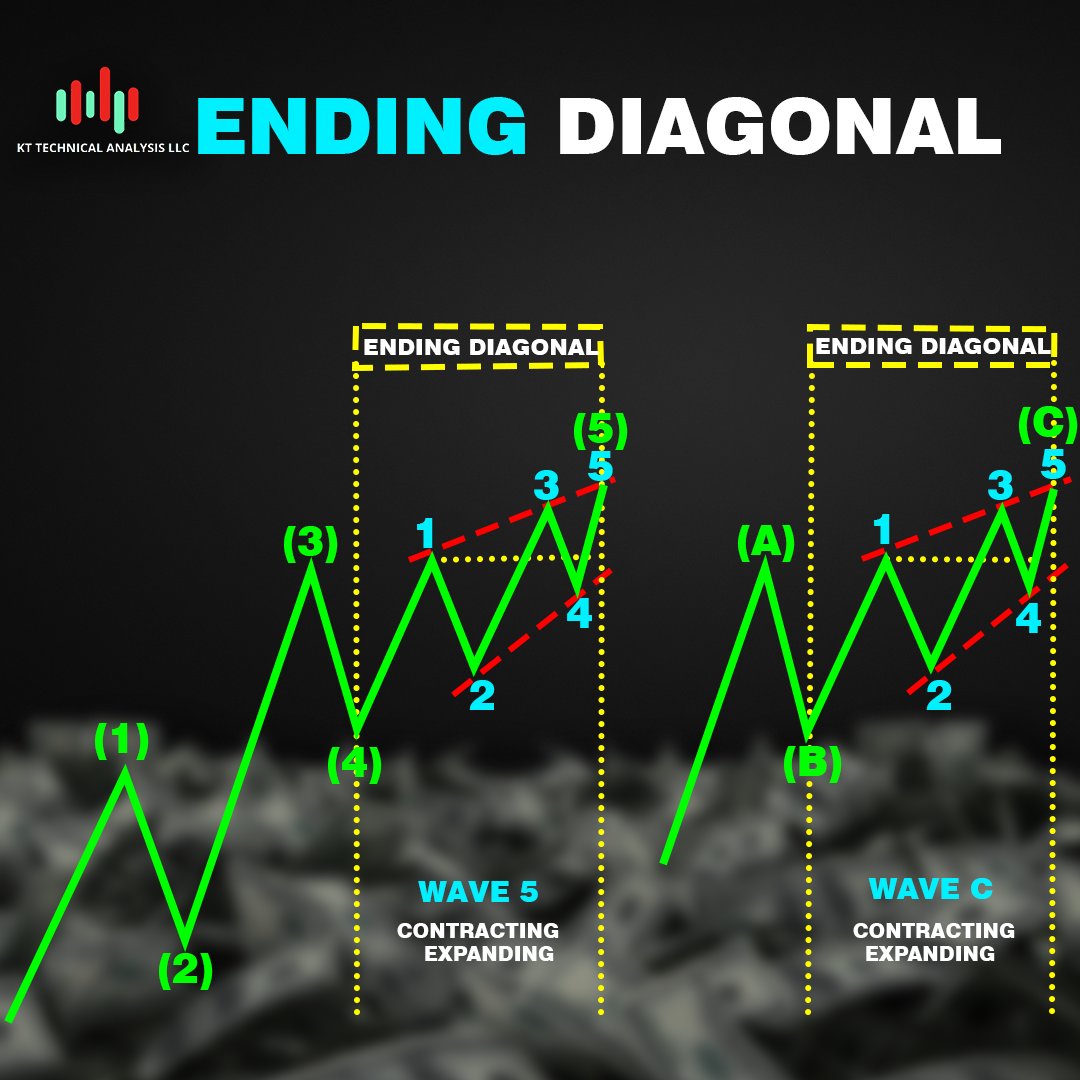
Trading 101: Elliot Wave Diagonal Pattern Leading diagonals are five-wave structures within impulse waves. They contract, meaning waves get smaller. This contraction suggests a potential trend reversal or pause. The image shows a leading diagonal with numbered waves 1-5
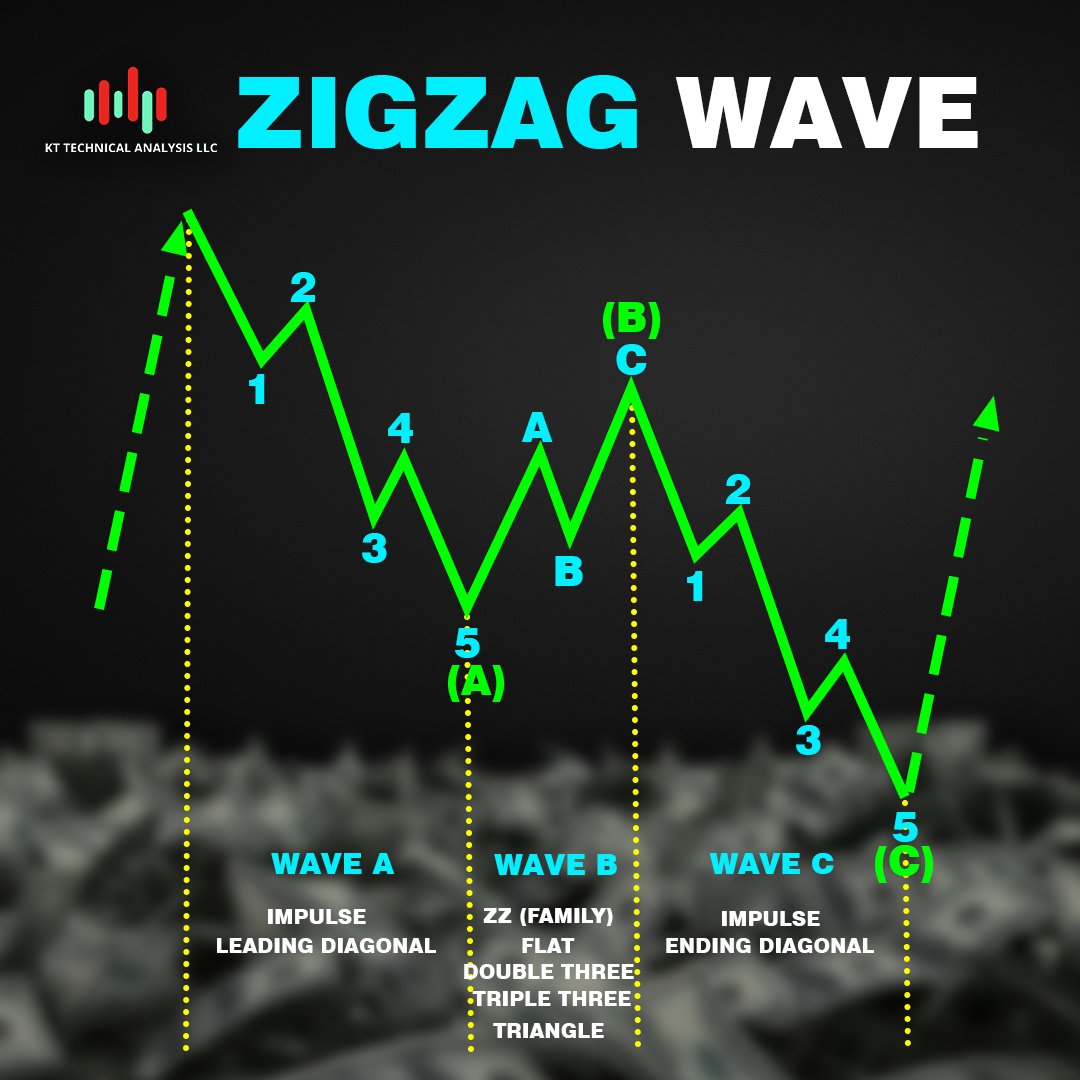
Trading 101: Elliot Wave Zigzag Pattern The Zigzag Pattern is a corrective formation that aids traders in spotting potential reversal points during market corrections. The simple zigzag typically follows a 5-3-5 structure. In Wave A, prices decline in five smaller waves,


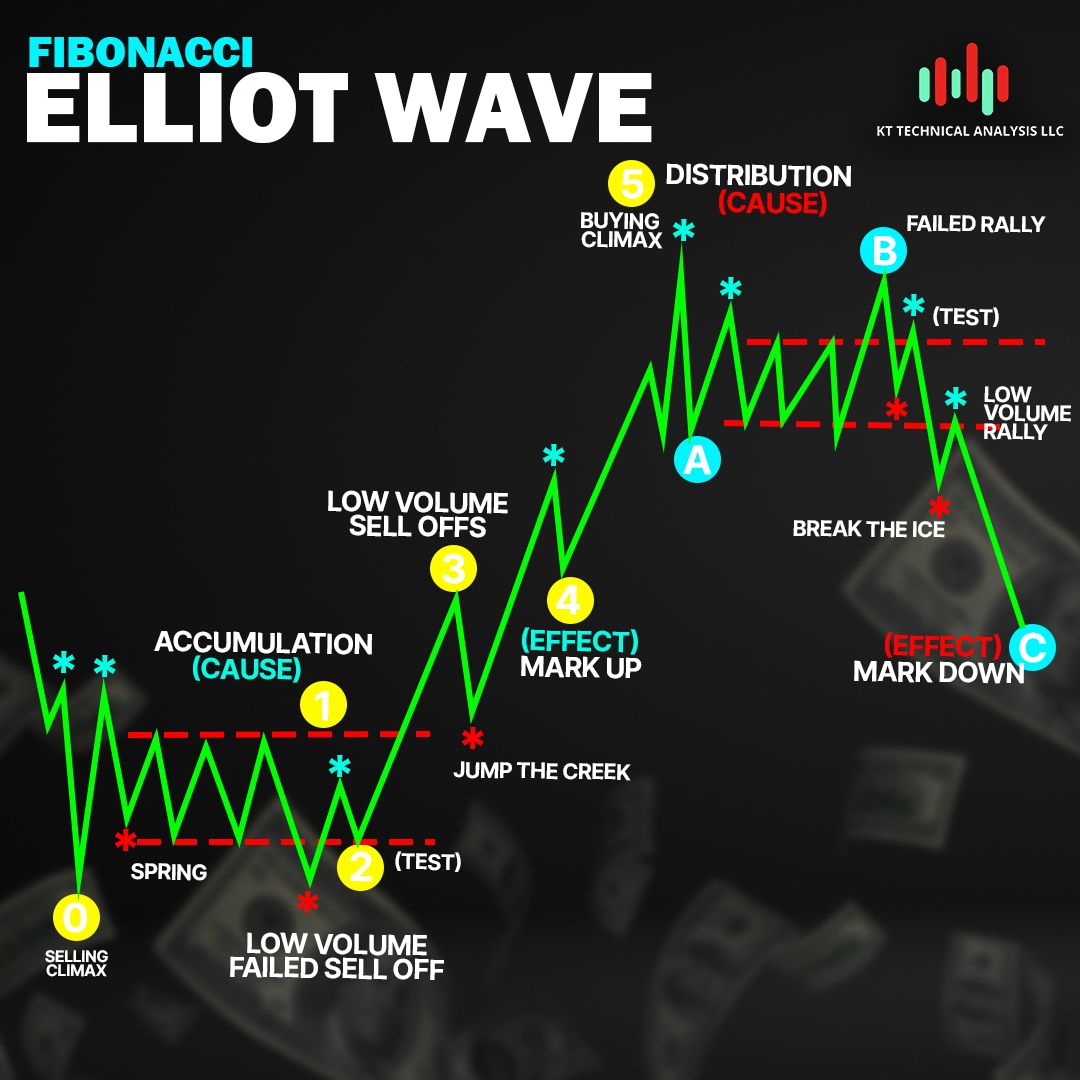
Trading 101: Elliot Wave Fibonacci The Elliott Wave combined with Fibonacci levels illustrates a full market cycle: accumulation, markup, distribution, and markdown. Each phase represents a shift in market sentiment. Starting with accumulation after a selling climax, followed
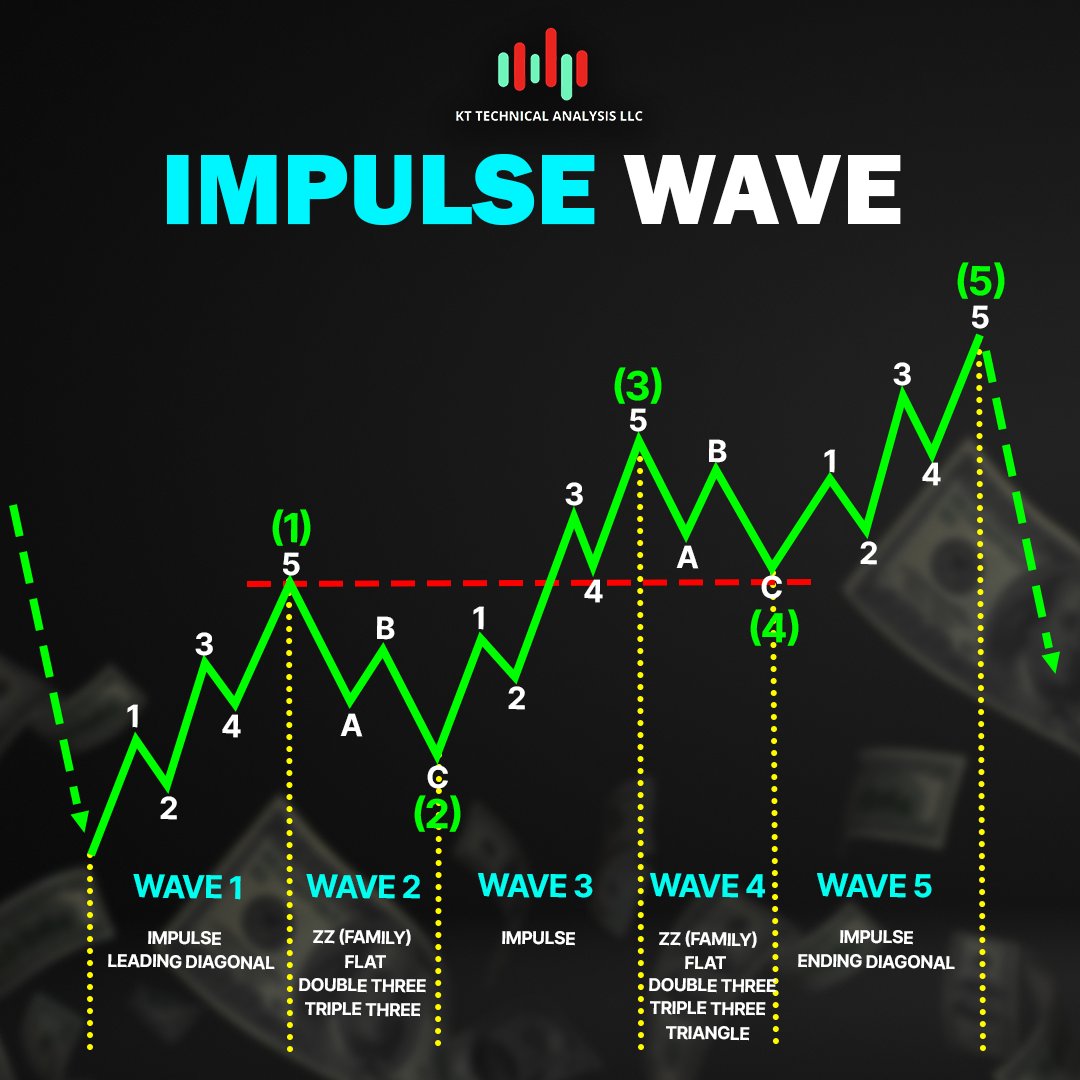
Trading 101: The Elliott Wave Impulse Wave Is a five-wave pattern that signals the direction of the market’s main trend. It consists of three advancing waves (1, 3, and 5) in the trend’s direction and two corrective waves (2 and 4) moving against it. Wave 1 begins the
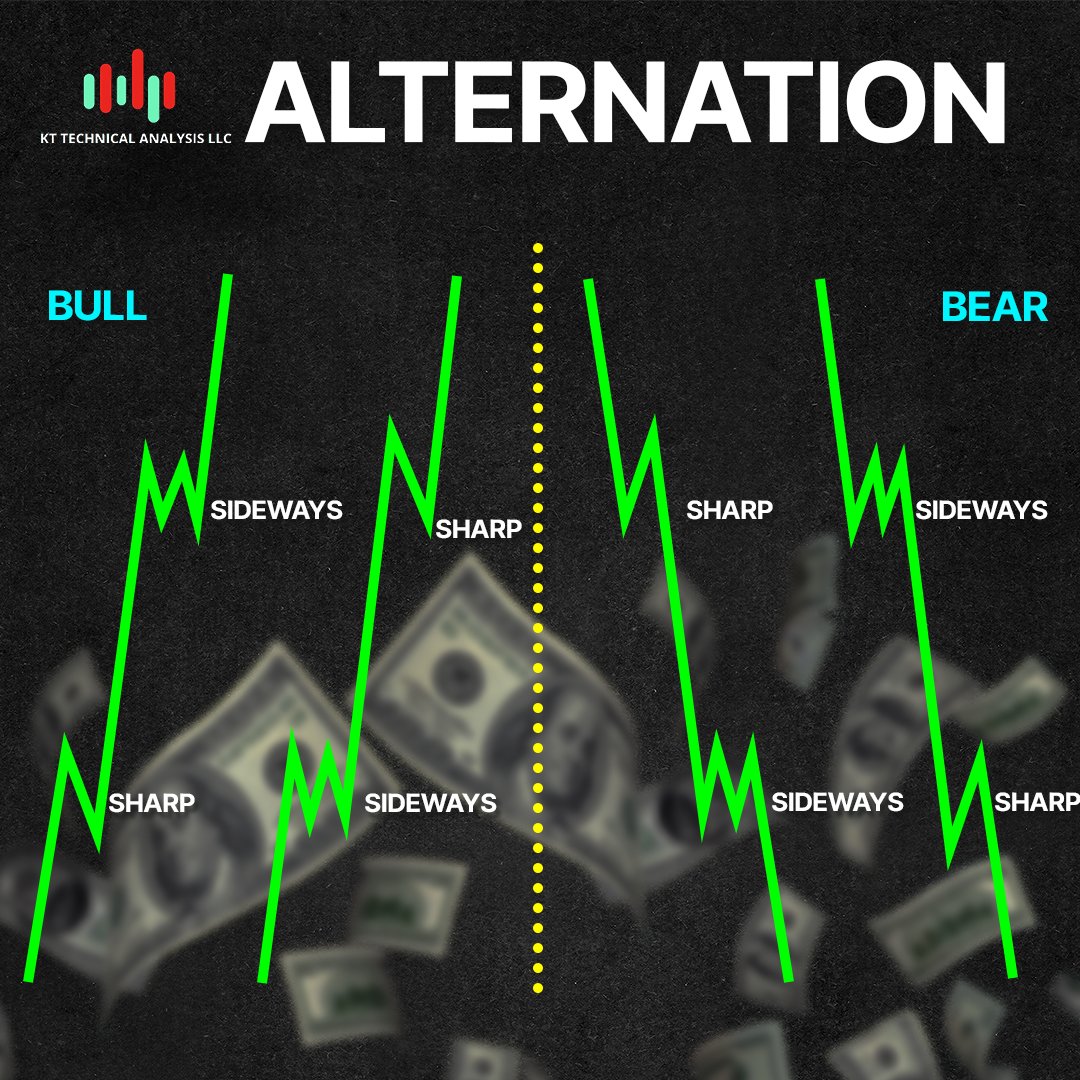
Trading 101: Elliot Wave Guidelines of Wave Formation Elliott Wave Theory offers powerful tools to understand market dynamics. Two key concepts, channeling and alternation, can significantly enhance your trading strategies. Channeling involves identifying trendlines that
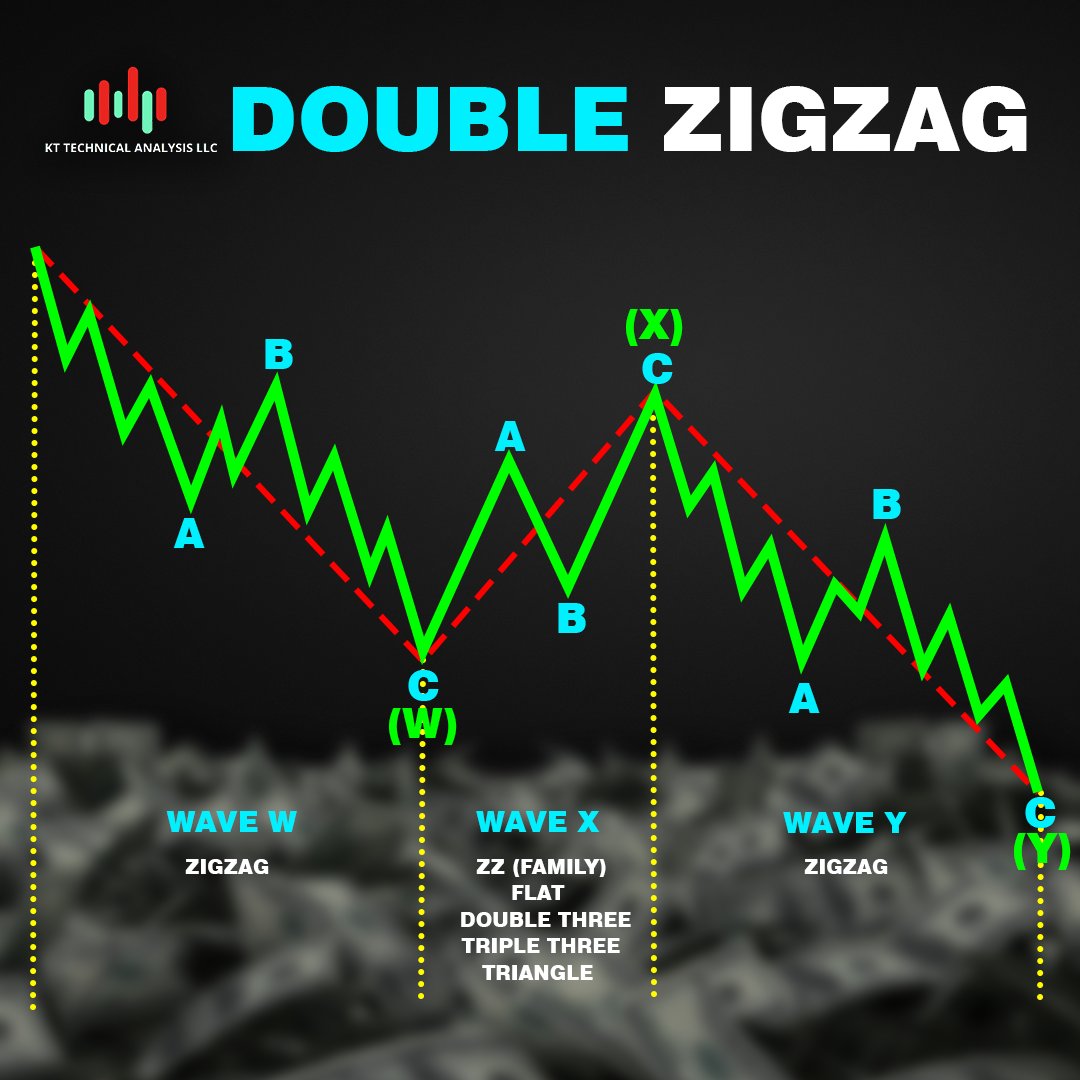
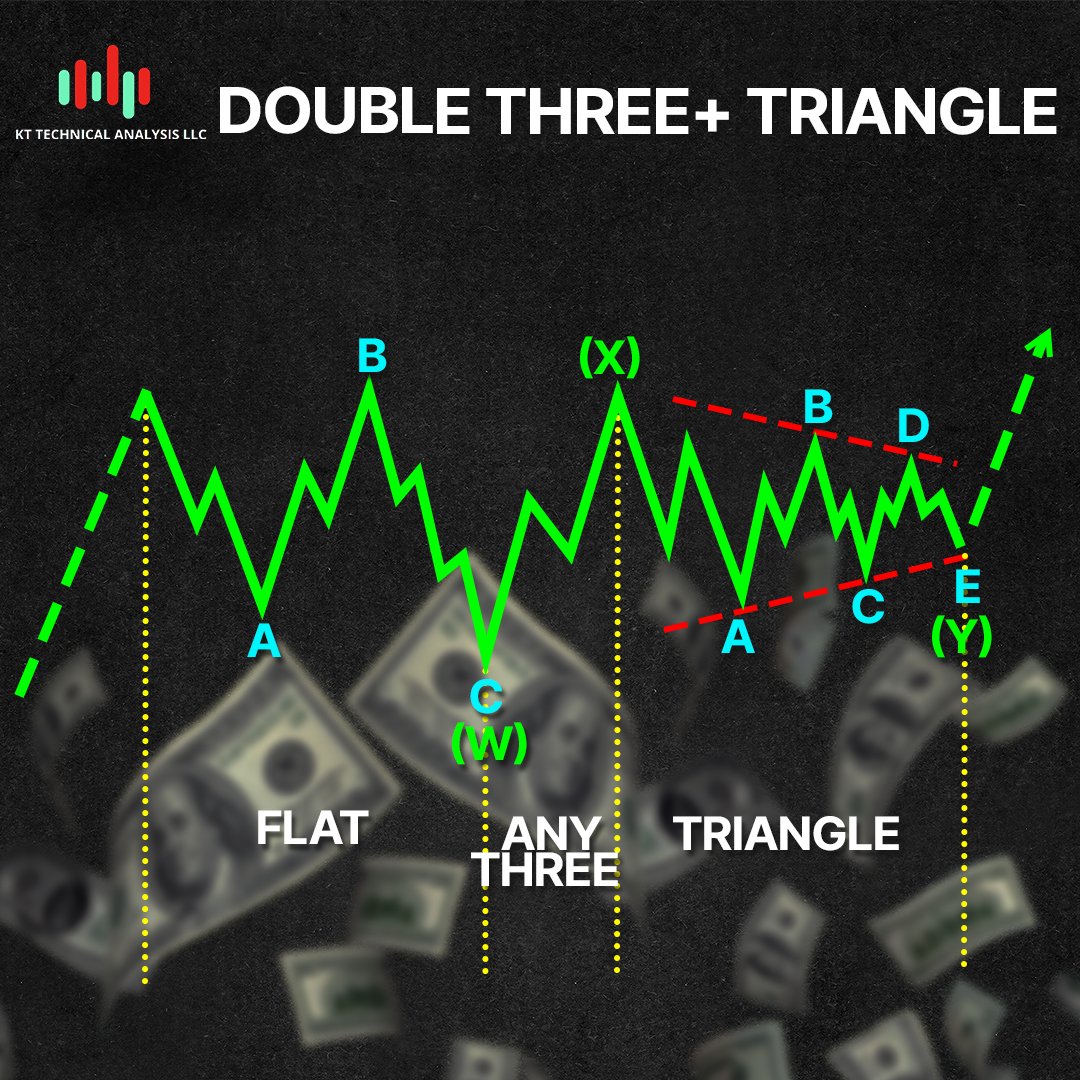
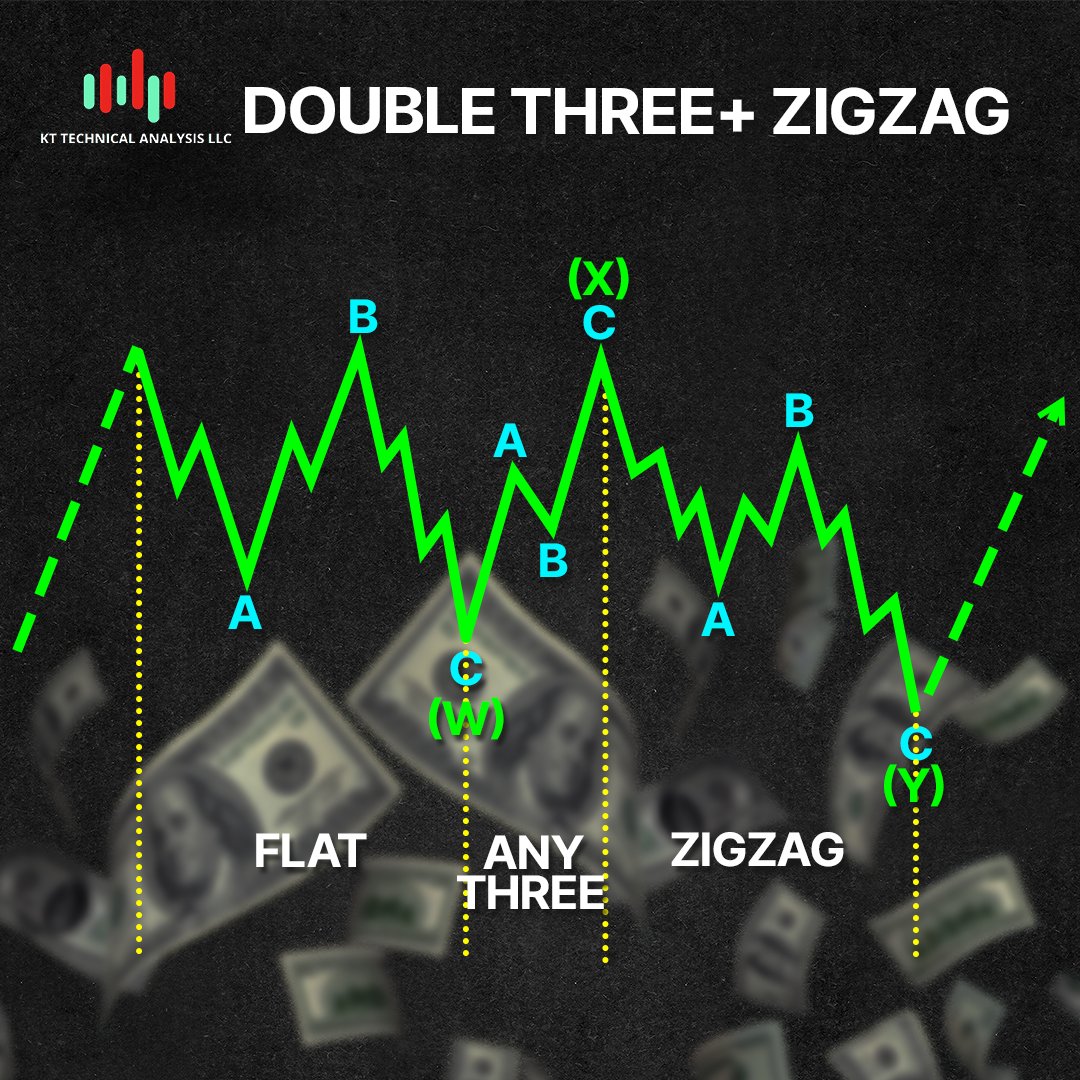
Trading 101: Elliot Wave Combinations The Elliott Wave Combination Patterns, like Double Three + Triangle and Double Three + Zigzag, represent complex corrective structures used to understand market corrections. Double Three + Triangle: This pattern combines a Flat correction
Trading 101: Elliot Wave Truncation Wave Elliott Wave Theory offers valuable insights into market behavior. One such pattern is the truncation, which signals a potential trend reversal. A truncation occurs when the fifth wave of an impulse wave fails to exceed the high of the

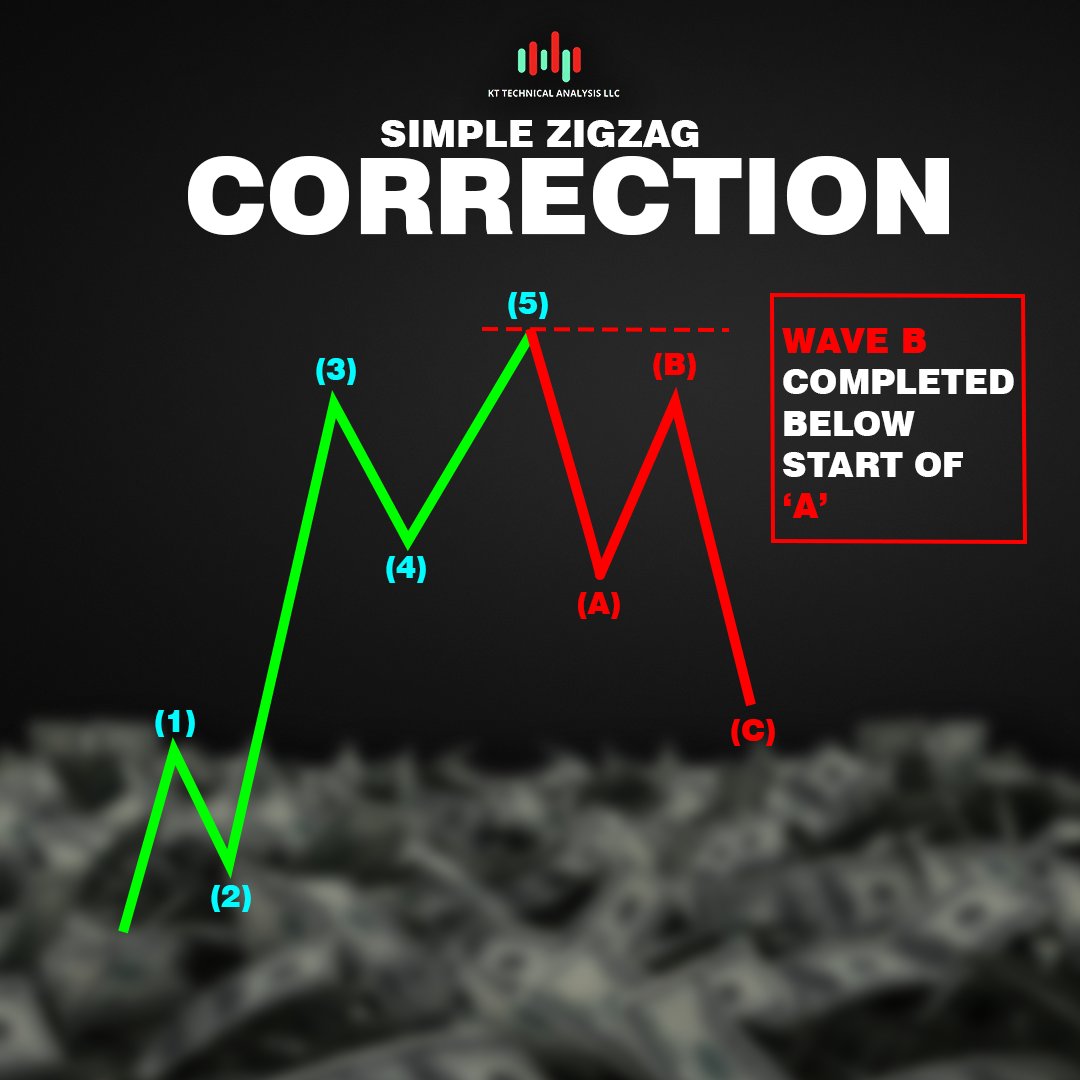
Trading 101: Elliot Wave Simple Zigzag Correction A simple zigzag correction is a basic corrective pattern in Elliott Wave Theory. It consists of three waves labeled A, B, and C. Wave A must always be an impulse wave, meaning it follows a 5-wave structure. Wave B can be any

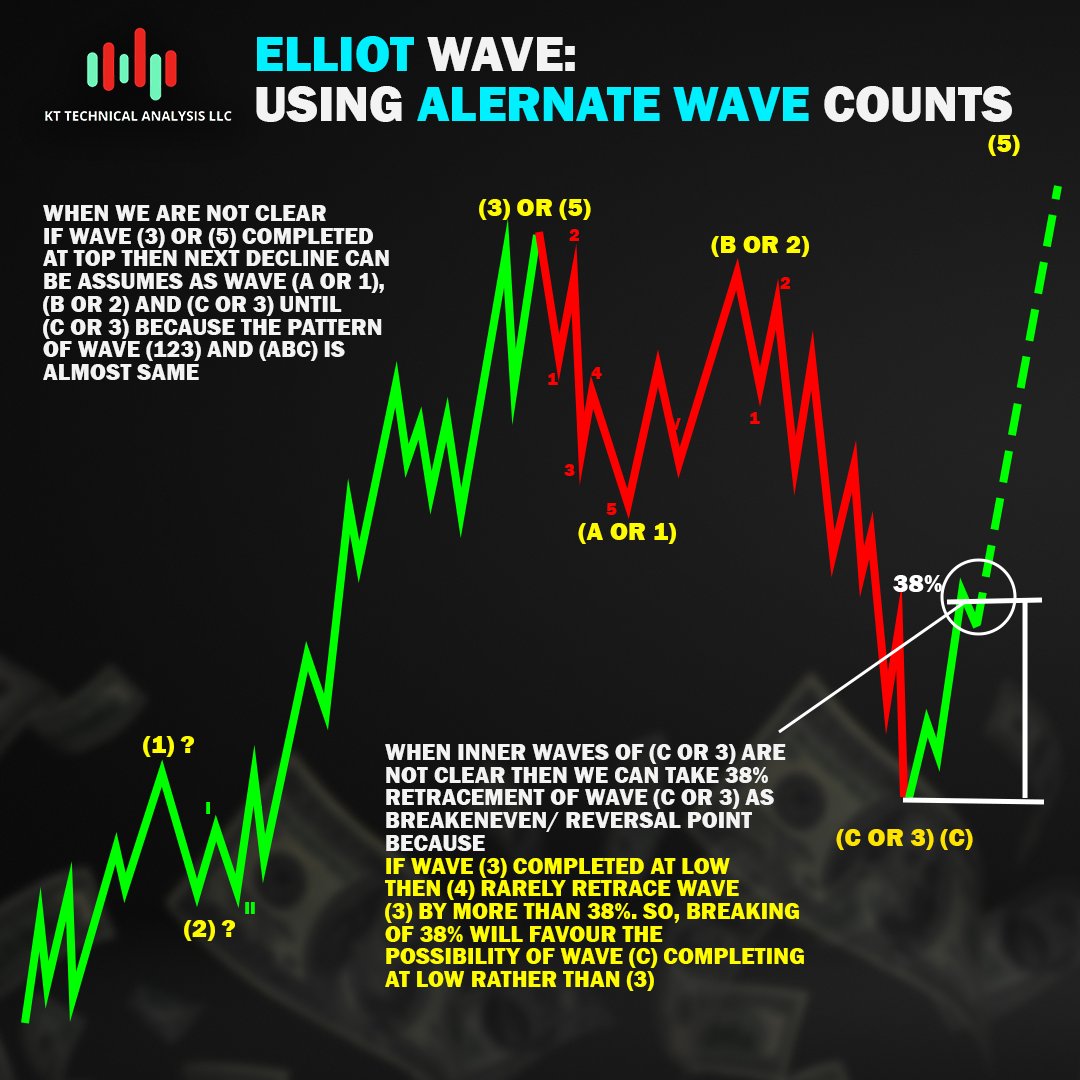
Trading 101: Elliot Wave Using Alternate Wave Counts When uncertainty arises about whether a particular wave is Wave 3 or Wave 5, considering alternate wave counts can provide valuable insights. By analyzing the price action, volume, and other technical indicators, traders can
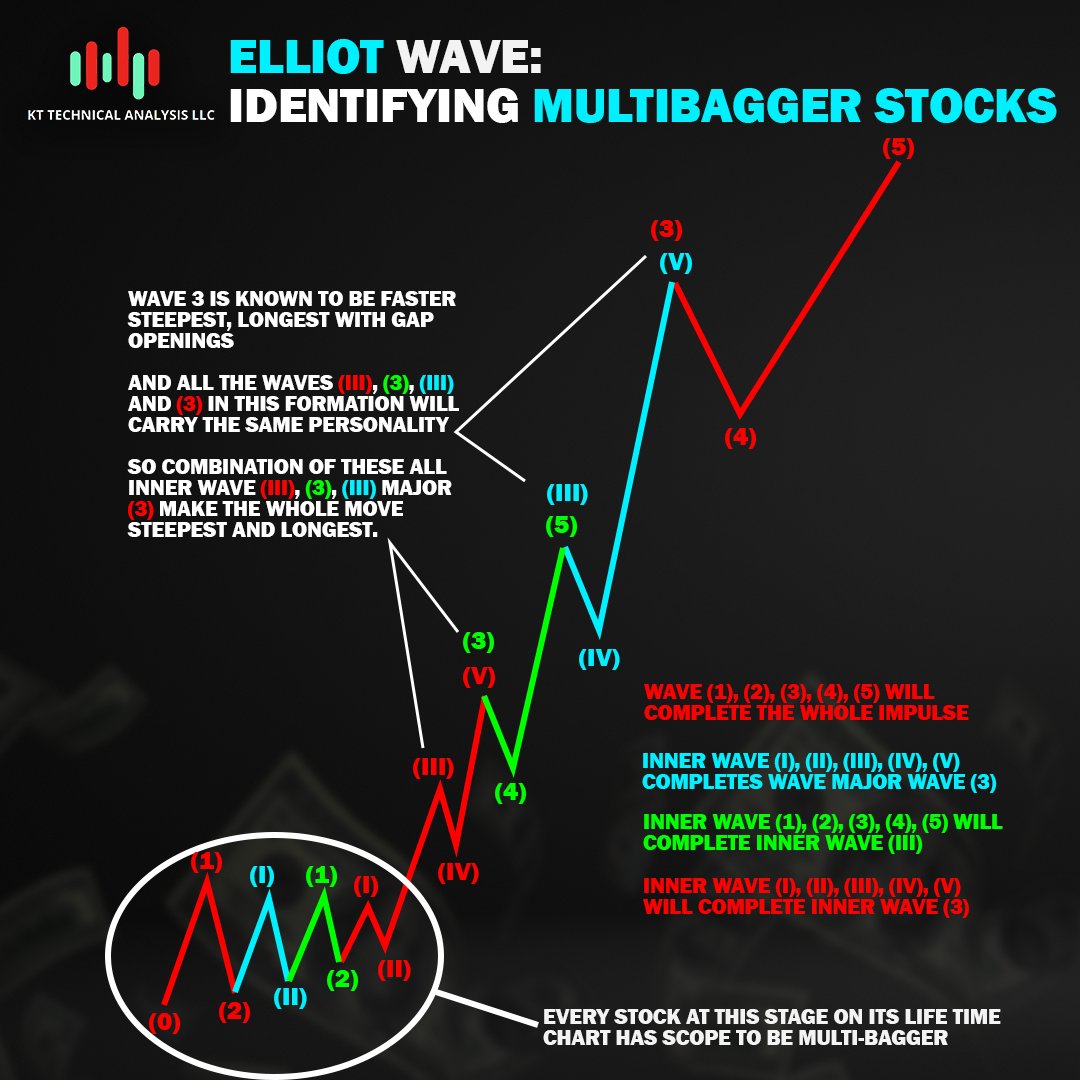
Trading 101: Elliot Wave Identifying Multi-Bagger Stocks The provided image demonstrates the hierarchical structure of Elliott Wave patterns. The larger degree wave (3) is composed of smaller degree waves, which in turn are composed of even smaller degree waves. The larger
Trading 101: Irregular Correction Irregular corrections are less understood than Simple Zigzag Corrections, despite being more common in Elliott Wave Theory. This pattern occurs when Wave B extends beyond Wave A or retraces more than 100%. While Wave A and C are typically


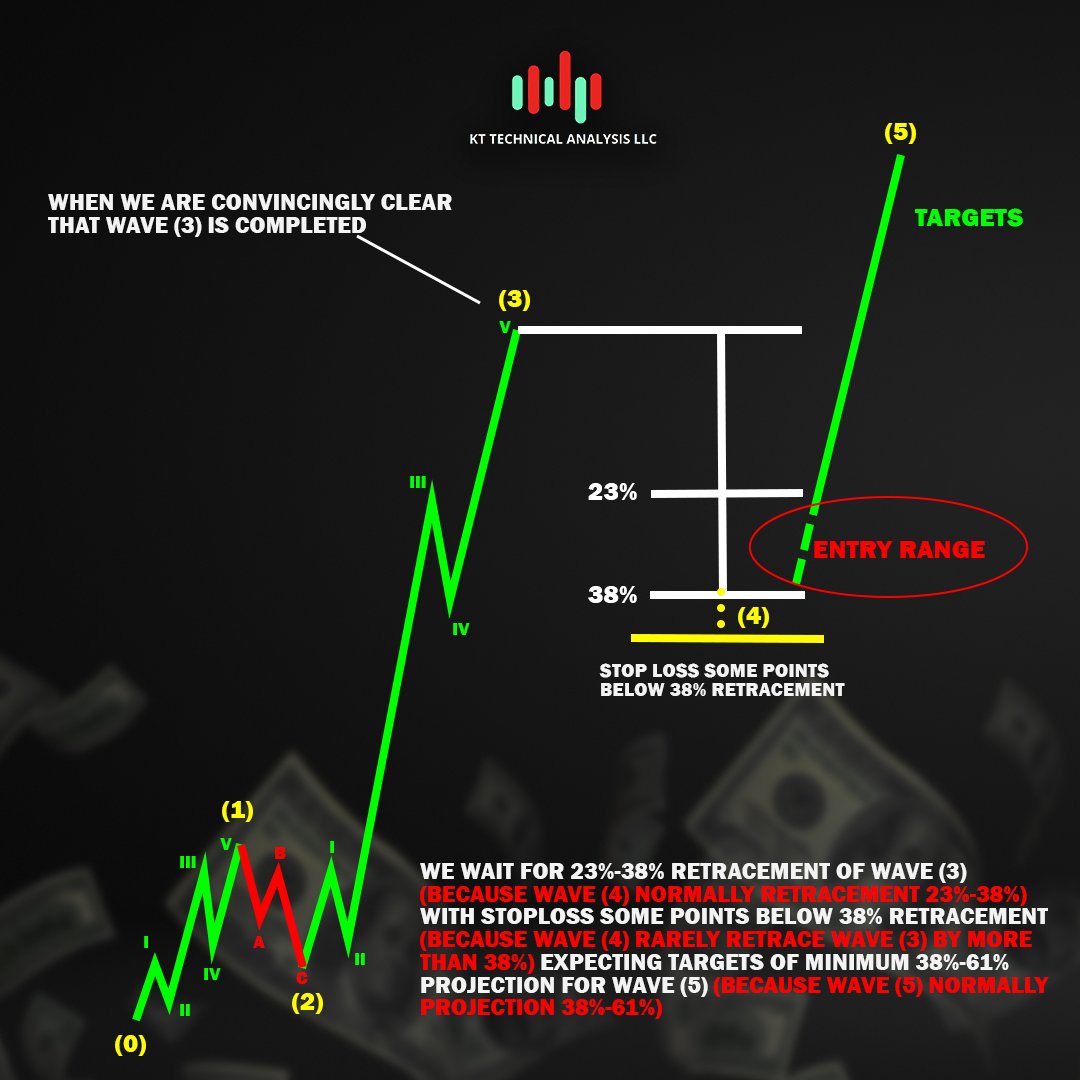
Trading 101: Elliot Wave Importance of 38% Retracement Identifying the exact wave structure can be challenging, especially when patterns are incomplete or unclear. In such cases, the 38% retracement level can be a valuable tool. When uncertainty arises about the completion of


Trading 101:Elliot Wave Double Irregular Correction This image illustrates a Double Irregular Correction, a complex Elliott Wave pattern where both the inner and outer Wave B extend beyond their respective Wave A's. This pattern often signals a significant market correction or
