
LLMs have complex joint beliefs about all sorts of quantities. And my postdoc @jamesrequeima visualized them! In this thread we show LLM predictive distributions conditioned on data and free-form text. LLMs pick up on all kinds of subtle and unusual structure: 🧵
This is fun because LLMs can condition on free-form side information, and make predictions about anything. This turns qualitative knowledge into quantitative predictions. Here we condition Llama 3 on two datapoints, plus text. Changing the text changes the meaning of the data.
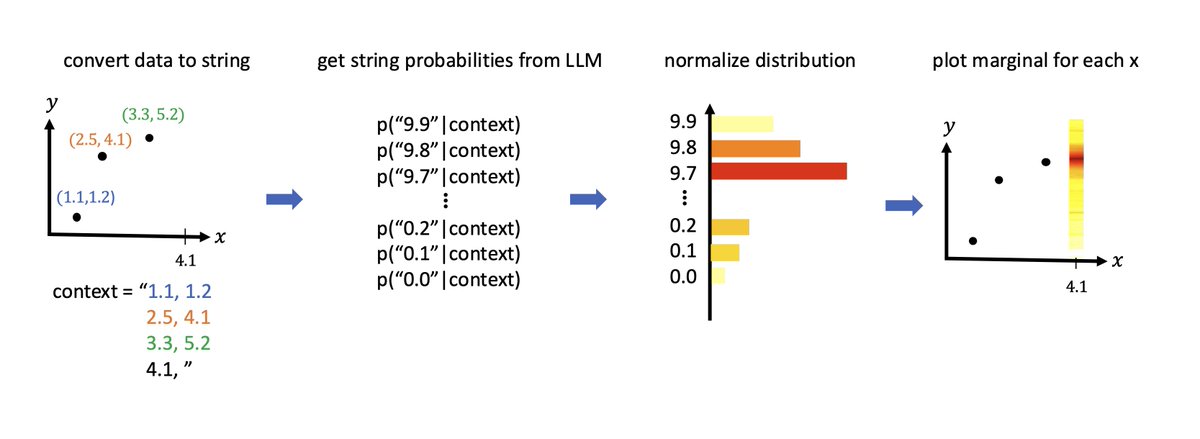
What are we visualizing, exactly? It's pretty simple: first we convert the dataset to a single long string, ending with the location we want to predict at. Then we evaluate the LLM's logits on each possible output value to get its probability given the data.
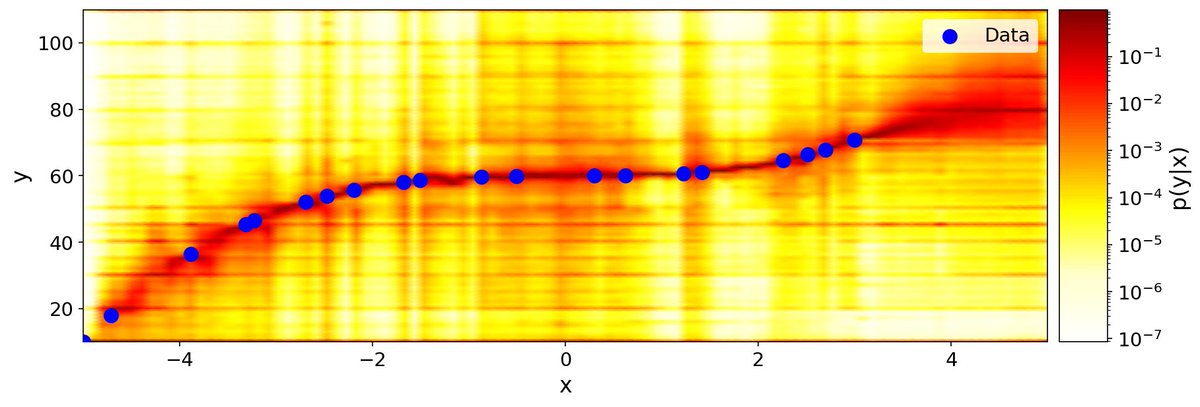
LLM posteriors have all sorts of interesting structure that you don’t normally see in e.g. Gaussian Processes. For instance, here Gemma 2 expects that values might be rounded to the nearest 5 or 10, resulting in horizontal lines:
LLM posteriors also automatically account for all kinds of data corruption and preprocessing. Here, we clipped all data above 50, and the model noticed and put very little probability above that threshold, even when it went against the trend:

These visualizations use tricks from our LLM processes paper, which worked out some of the details of how to format numerical data and elicit continuous distributions from LLMs: https://arxiv.org/abs/2405.128... Code: https://github.com/requeima/ll...
@jamesrequeima also did follow-up work on time series with @ServiceNowRSRCH. This included benchmarking big LLMs on time series tasks where conditioning on side information was crucial: Paper: https://arxiv.org/abs/2410.189... Code: https://github.com/ServiceNow/...

That paper showed that getting good performance from LLMs is really simple: Just concatenate all your data and any extra info you have together, and ask the LLM to make predictions in the same format. This tweet laid it out nicely: https://x.com/giansegato/statu...
You can really stick any kind of data into this method. LLMs implicitly define joint distributions over tables with any kind of data, and as usual, benefit from extra side information. Paper: https://arxiv.org/pdf/2502.118... Code: https://github.com/cambridge-m...

We’re all ears for ideas of where to take these tools next. Reply with ideas for prompts and data to try this on! E.g.: “Per-year earnings of someone who discovered Factorio at age 30” “Sexual partners per year of someone who joined a cult and then led another cult”
It's also clear that token-based LLMs aren't coherent or consistent in many ways. One opening for future work is to get them to handle continuous values and distributions more natively.
Some people who might be interested in these LLM posterior visualizations: @OwainEvans_UK @repligate @andrewgwils @StatModeling @NeelNanda5 @ch402 @SamuelAckerma18 @ZoubinGhahrama1 @fhuszar @NicolasChapados @alexandredrouin @arjunashok37 @CluelessAndrew @alex_lacoste_
Also, @jamesrequeima is on the job market. Hit him up!
This work was inspired by Andrew Gelman’s criticism of subjective Bayes: “Why should I believe your subjective prior? If I really believed it, then I could just feed you some data and ask you for your subjective posterior.” We say: Actually, that’s a great idea for LLMs!
We don’t use humans’ subjective posteriors because they can’t update correctly on reams of data. You’d need some sort of galaxy brain who had endlessly practiced updating on all kinds of datasets and making calibrated predictions. But that’s what LLMs are!