
If you are a swing trader, this 🧵 is for you. There are three patterns that commonly form and can give you amazing buying opportunities in stocks after a big downtrend. In this thread, you will find some great insights on price action. Bookmark it and read later. 💥 (1/18)
First, try to understand the overall trend of the market by following the small-cap index. You can check my YouTube video on how to track the index for more information. (2/ https://youtu.be/eXTC_9yZTTs?s...
Once you observe any recovery in the index after a downtrend, begin analyzing stock charts. Ensure you have a list of stock names ready. Join my telegram channel for regular price action learnings. I share short videos here - (3/ https://telegram.me/LearnBette...
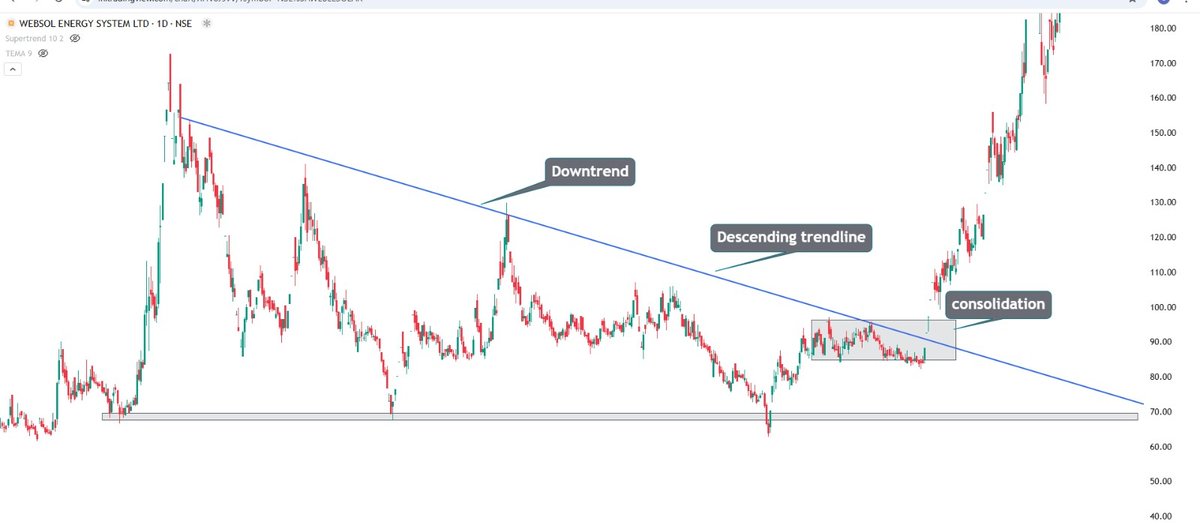
First Pattern - Descending Trendline What is a Descending Trendline? When the price forms lower highs and lower lows, you can connect the lower highs to draw a trendline. (4
There should be more than two touches. As long as the price remains below the trendline, the downtrend is considered solid and intact. This pattern typically begins to form when the index reaches a peak. If it is touched multiple times, around 4-5 times.. (5/

..the trendline becomes weaker and eventually it is likely to break to the upside. How to trade -Initiate a trade once it breaks to the upside. A break above the trendline indicates a trend reversal and you can consider taking a buying trade after the breakout. (6/
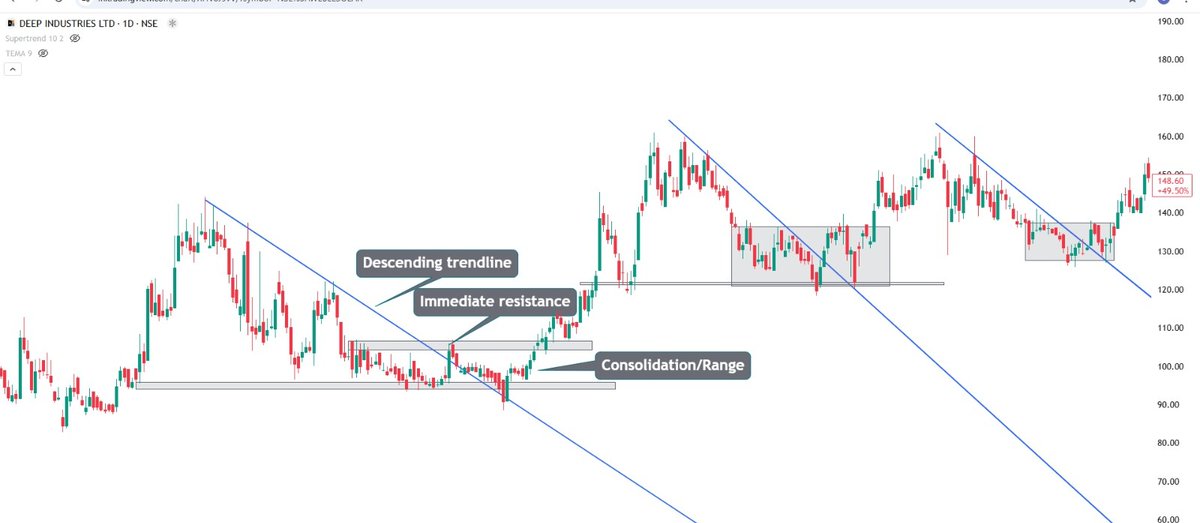
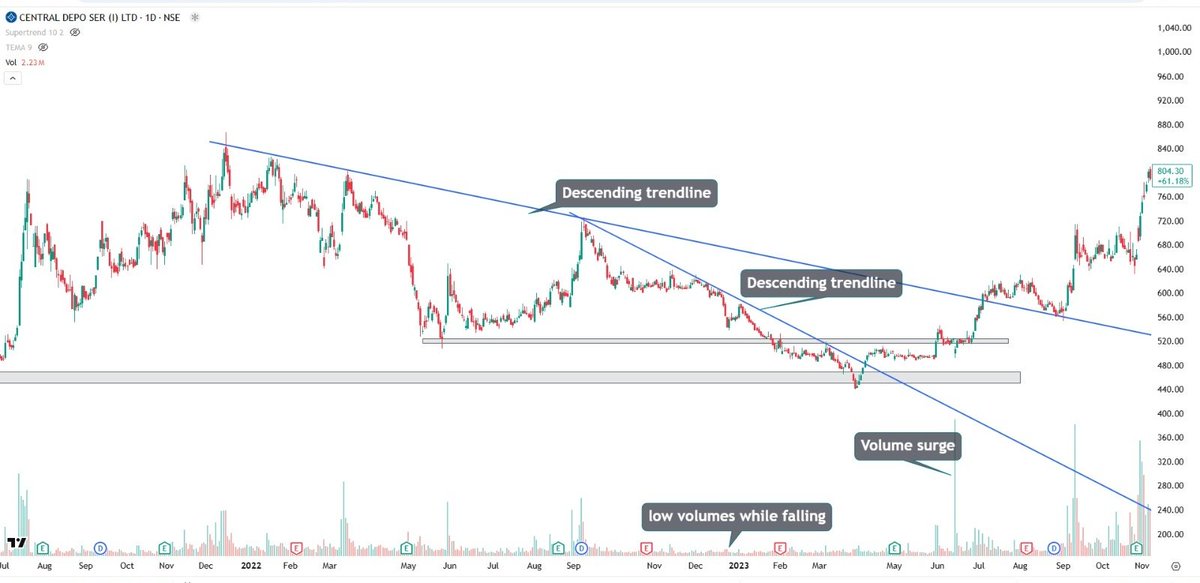
The price may attempt to give false breakouts once or twice. Generally, early breakouts from the trendlines are false. and eventually, we may experience a genuine breakout. When this occurs, just do not miss the breakout under any cost. (7/
Now, how can we confirm the breakout? When it breaks out of the descending trendline to the upside, there is typically an immediate resistance. If it fails to break immediate resistance after a trendline breakout, then it's a sign of a fake breakout. (8/
Volumes - When the stock is falling, the volume should be lower. When it breaks the trendline, the volume should increase in bullish candles. This increase in volume adds to the conviction of the breakout. This represents a proper trend reversal pattern. (9
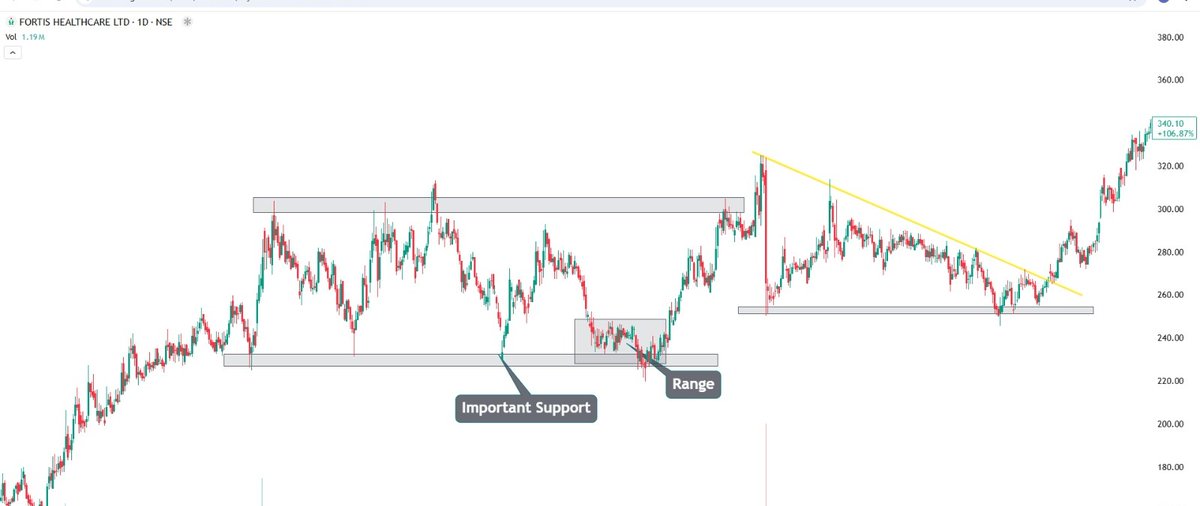
Second Pattern - Forms a base at important support/accumulation- After a downtrend, the price takes a pause and starts consolidating near a support zone, forming a range. It can consolidate for a few days before reversing. The larger the consolidation, the stronger the breakout.
Sometimes, if the downtrend is very strong, there's a possibility that it will break to the downside. Therefore, it's crucial to wait for a proper breakout to the upside and to also track the index. (11/
Volume often decreases as the market consolidates, indicating accumulation and increases when it gives the breakout. Stop-Loss: - Place SL orders below the lower boundary of the accumulation zone to protect against false breakouts. (12/
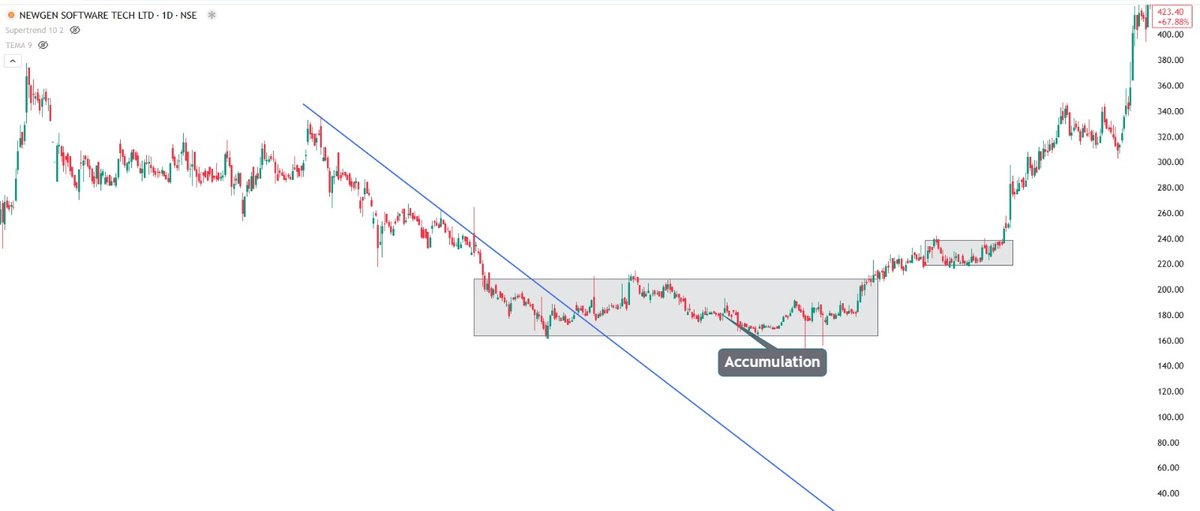
Target: Measure the height of the accumulation range and project it upwards from the breakout point to set a profit target. (13/
Third Pattern - Double Bottom A double bottom is a bullish reversal chart pattern resembling a "W." It forms when a price hits two similar lows with a peak in between, indicating strong support. When the price breaks above the peak, it suggests a potential upward trend. (14/
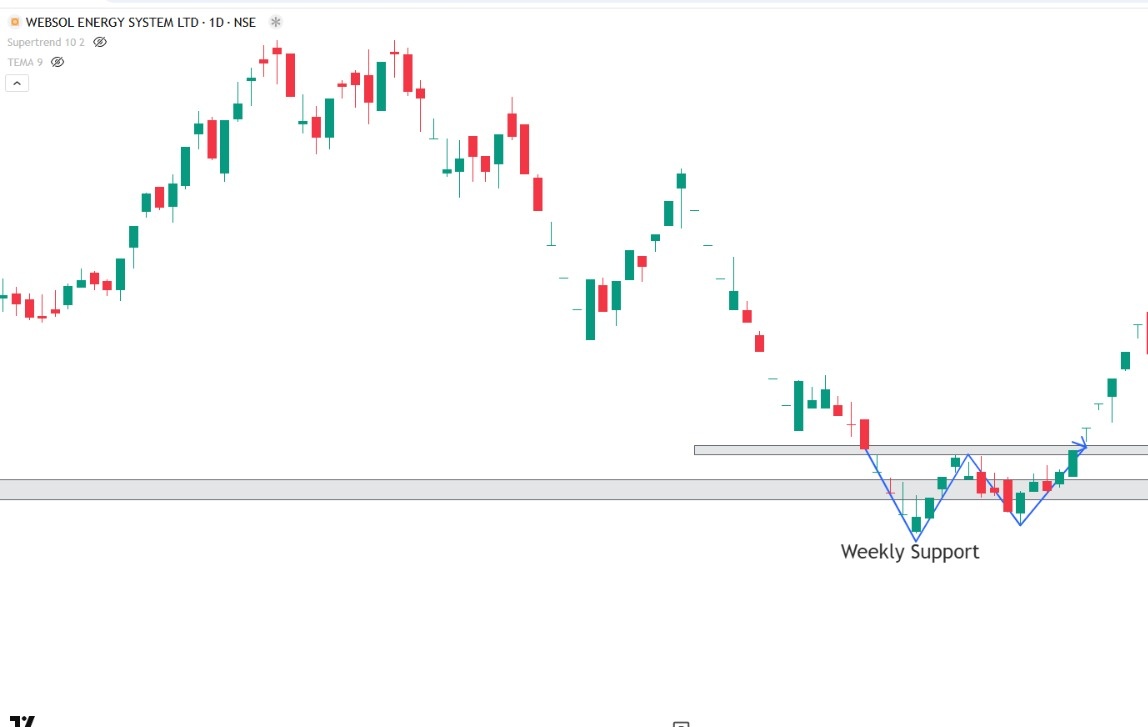
Enter long positions when the price breaks above the middle peak or confirmation line of the double bottom. Stop-Loss: Place SL below the second bottom to limit potential losses if the pattern fails. (15/
Target: Measure the distance from the second bottom to the confirmation line and project it upwards from the breakout point. General Tips - Patience: Wait for confirmation of patterns before entering trades. (16/
Risk Management: Never risk more than a small percentage of your account on a single trade. Backtesting: Test these strategies on historical data to build confidence. Using these strategies with proper risk management can help you capitalize on potential market reversals. (17/
If you find this thread helpful, like and Repost the first post and follow me for regular learnings. (18/18)