
🔥 Here are some of the most basic monitoring techniques you can start using immediately: - Spatie laravel-health - Error tracking - Syntethic checks It takes ~30 minutes to set up these. 🧵 Keep Reading

Health checks with laravel-health The package can check: - CPU load - Disk space utilization - Database connectivity - Redis - And even query speed

The example contains pre-built checks. For instance, it notifies you if the average CPU load is higher than 2.5 in the last 5 minutes or 2 in the previous 15 minutes. It also notifies you if the used disk space is more than 70%

You can also write custom checks for your own need. For example, QuerySpeedCheck is one I wrote. It notifies you if a particular query takes too long to execute. This is what it looks like:

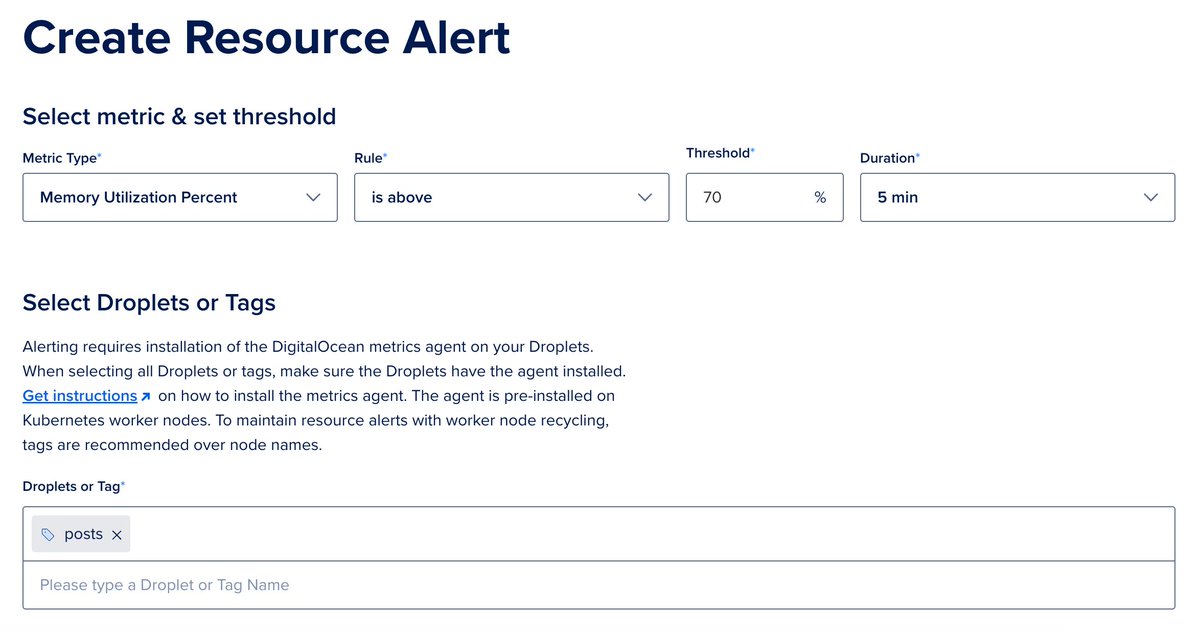
Syntethic checks For this, you can use something like Uptime Robot or Better Uptime. They send a request every minute to your site and notify you if it's unavailable or slow. Your server provider might also offer something like that. DigitalOcean looks like this:

You can (and should) also set resource and latency alerts. For example, this notifies me if the memory usage is higher than 70% on given servers:
Error tracking Instead of relying only on log files, you can install Rollbar or Sentry to track your errors in a more organized way. You only need to add a new log channel:
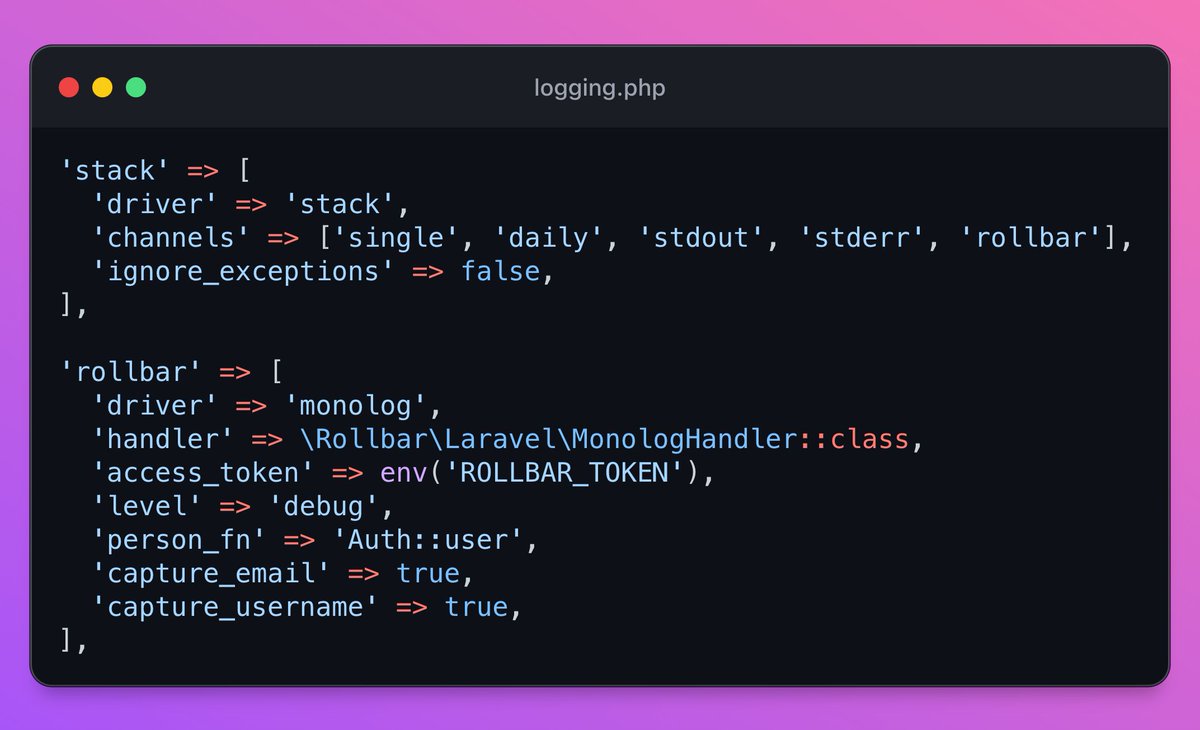
And then your provider collects your logs/errors in a more organized way than laravel.log does:

Thank you if you're still here! Just released a new book called Building a database engine. Check out the details here if you want to build your own database: https://thedatabasebook.com/