𝐋𝐞𝐭’𝐬 𝐝𝐢𝐯𝐞 𝐢𝐧𝐭𝐨 𝐭𝐡𝐞 𝐛𝐚𝐬𝐢𝐜𝐬 𝐨𝐟 "𝐓𝐫𝐚𝐝𝐢𝐧𝐠 𝐈𝐧𝐝𝐢𝐜𝐚𝐭𝐨𝐫𝐬" 𝐢𝐧 𝐭𝐡𝐢𝐬 𝐭𝐡𝐫𝐞𝐚𝐝!🎯 1. MACD 2. RSI 3. Bollinger Bands 4. Volume 🧵(1/16)
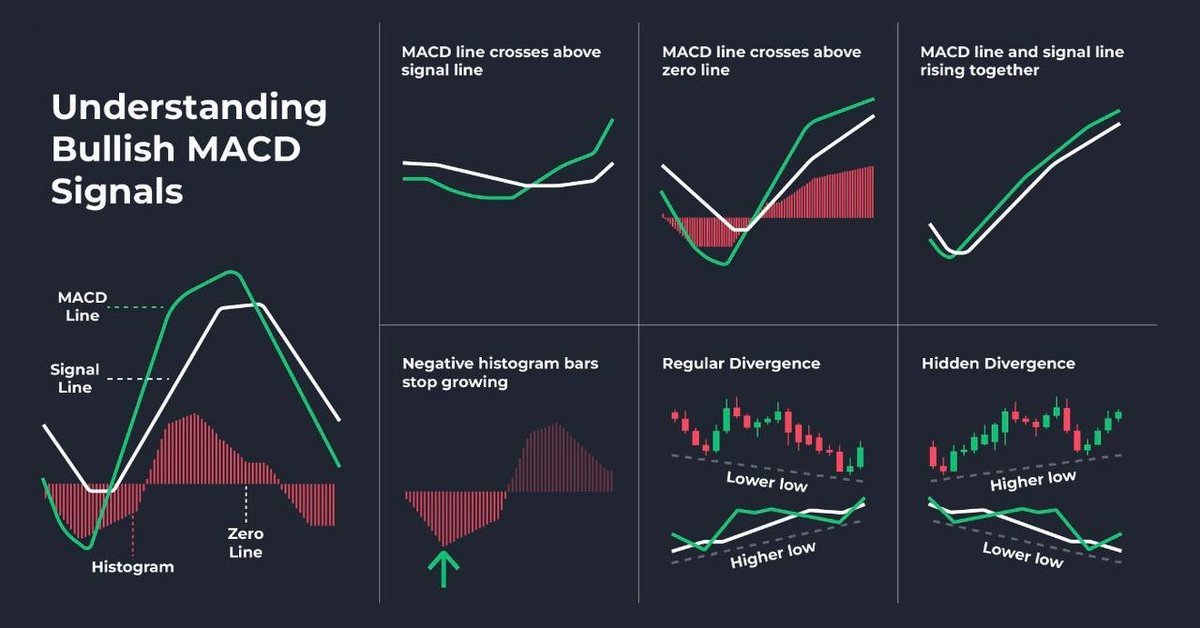
1. MACD Is a Momentum Oscillator Primarily used to Trade Trends. Shows the Relationship between two Moving Averages of a security's price.
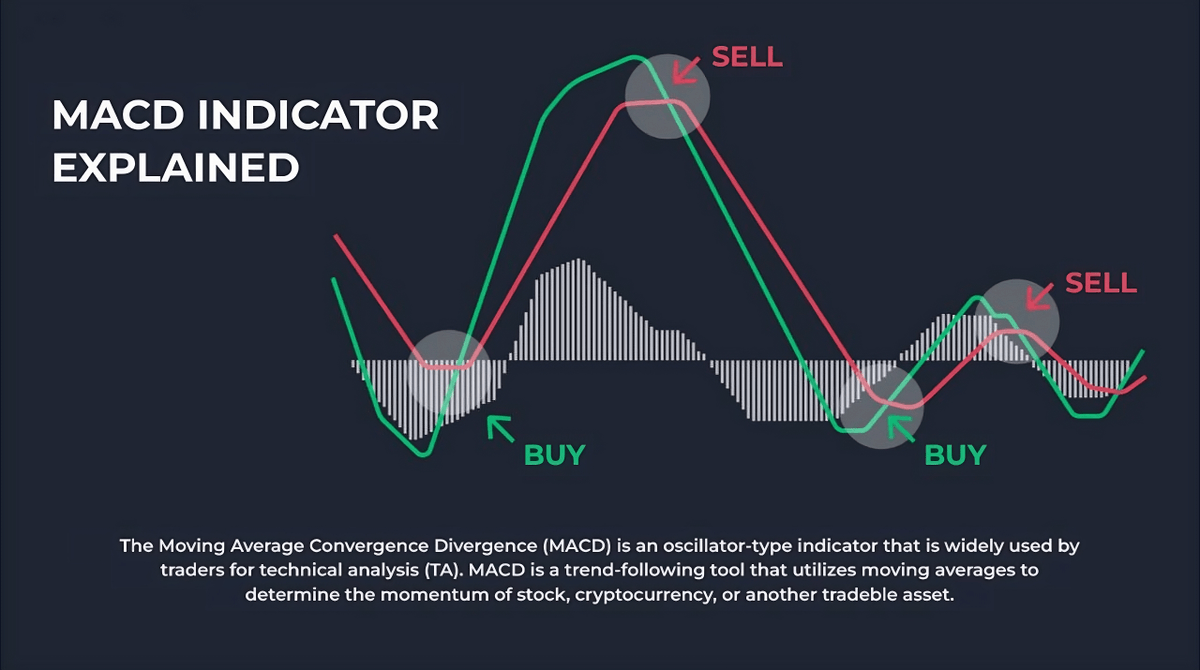
1.1 MACD When the crossing of the MACD line with the Signal line occurs from the bottom up, the trend will be bullish. When the crossing of the MACD line with the Signal line occurs from top to bottom, the trend will be bearish.
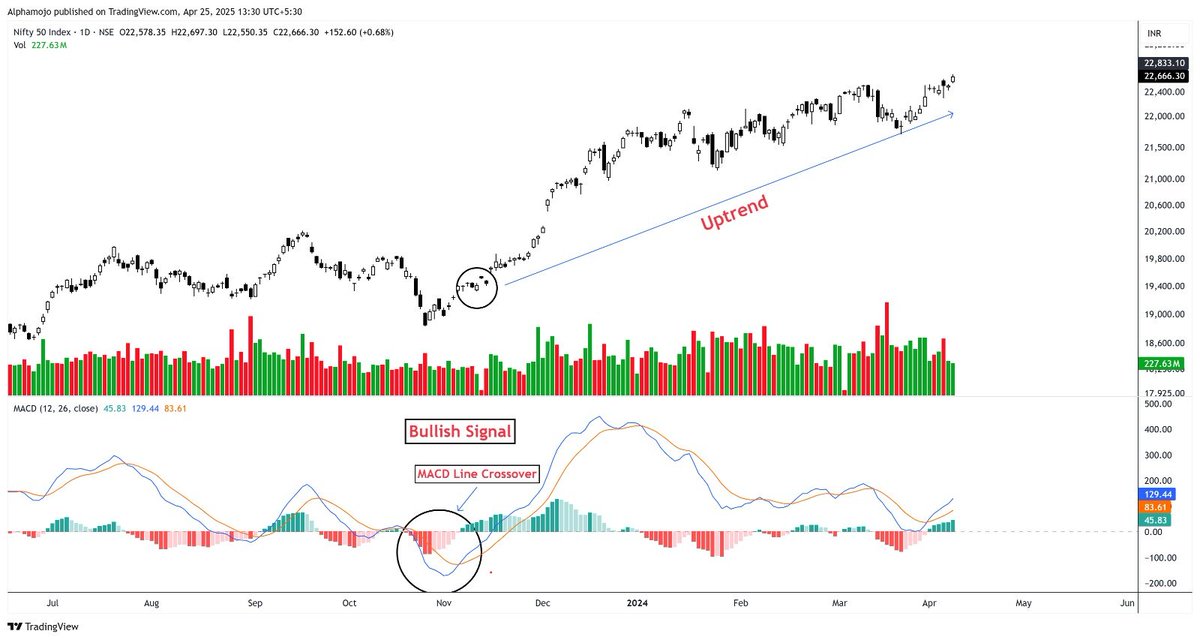
1.2 MACD A bullish divergence appears when MACD forms two rising lows that correspond with two falling lows on the price. This is often a valid bullish signal when the long-term trend is still bullish. In this example there are more bullish divergences.
2. RSI RSI is an oscillator that reflects the relative strength, between the uptrend and the downtrend. RSI indicator around level 30: reflects oversold levels RSI indicator around level 70: reflects overbought levels
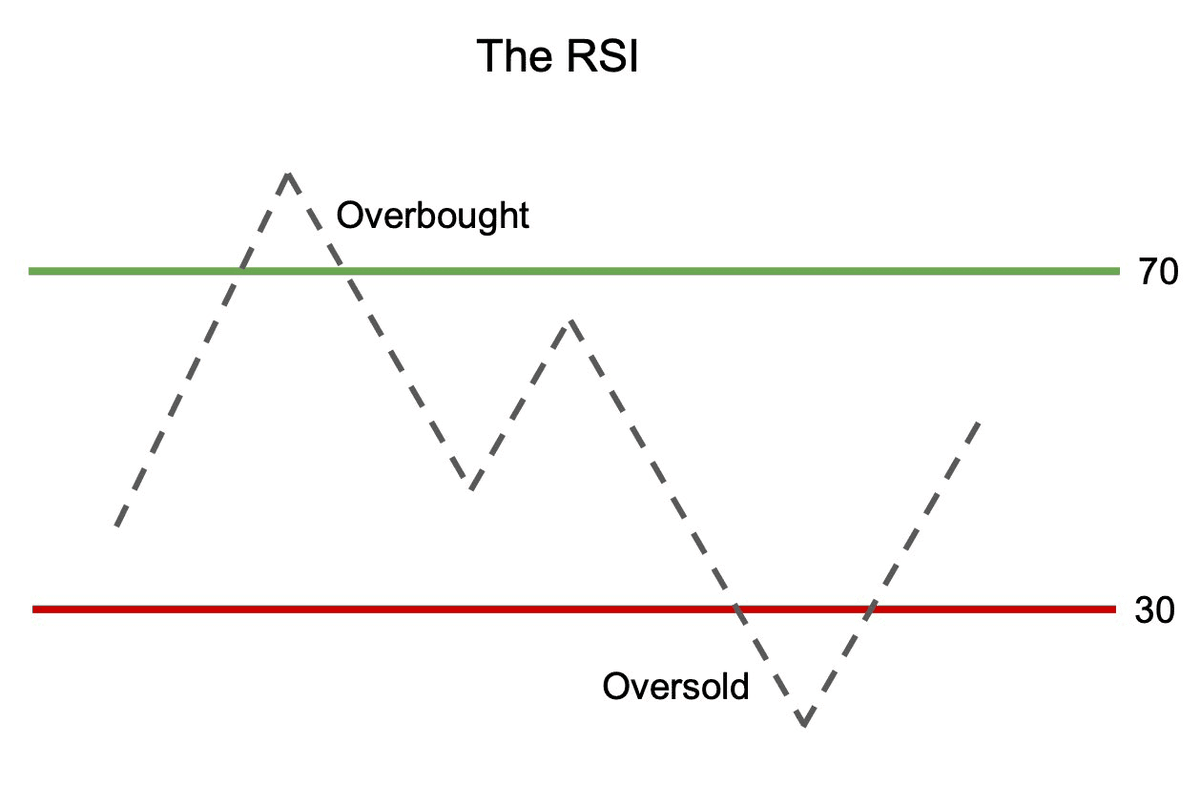
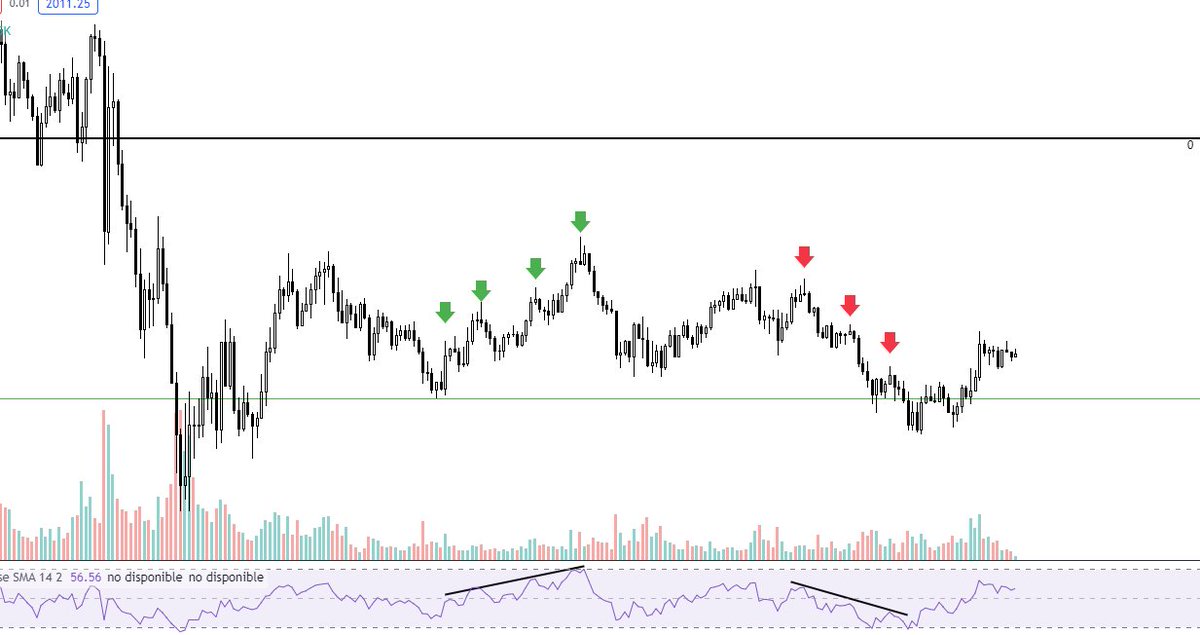
2.1 RSI To draw an uptrend line on the indicator: You need to connect two or three or more peaks of the RSI indicator as HH points appear. A descending line is drawn by connecting three or more peaks as the points descend.
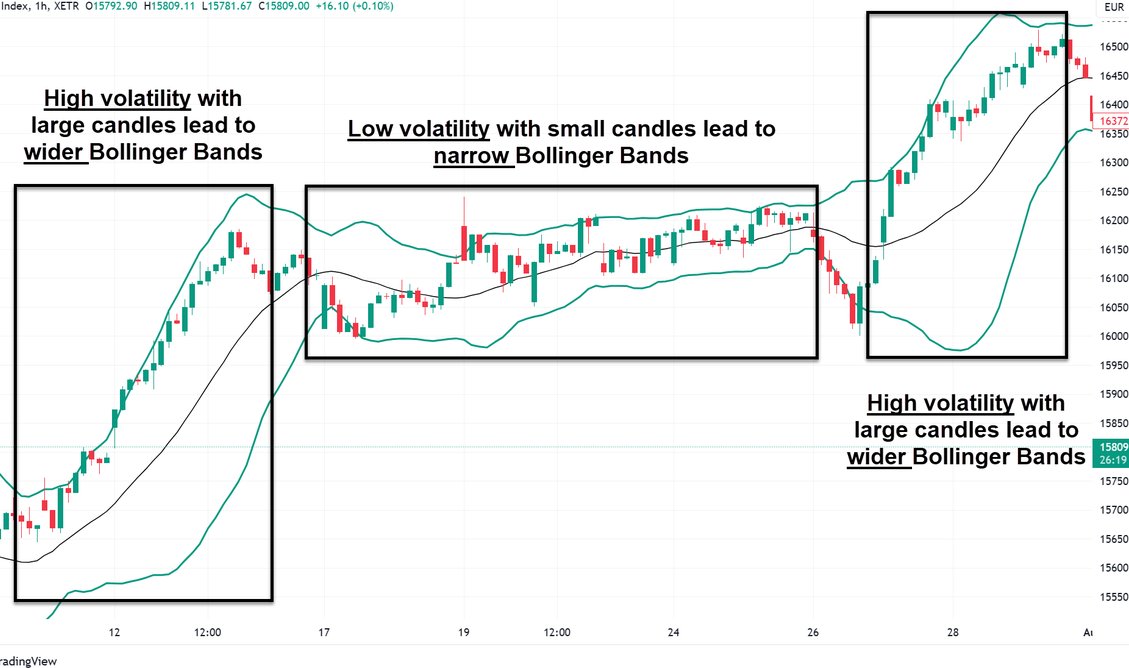
3. Bollinger Bands Bollinger Bands is a popular technical indicator that is used to analyze price volatility and potential trend reversals. It consists of three lines plotted on a price chart: the Upper band, the Middle band, and the Lower band.
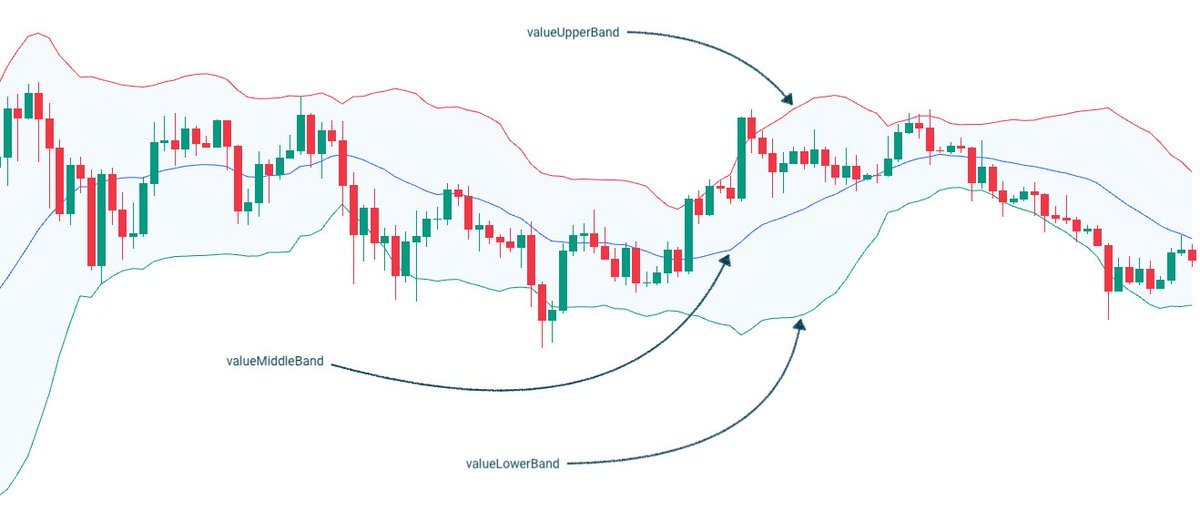
3.1 Bollinger Bands Bollinger Bands are based on price volatility, their bands which expand when the price fluctuates and trends strongly. The bands contract during sideways consolidations and low momentum trends.
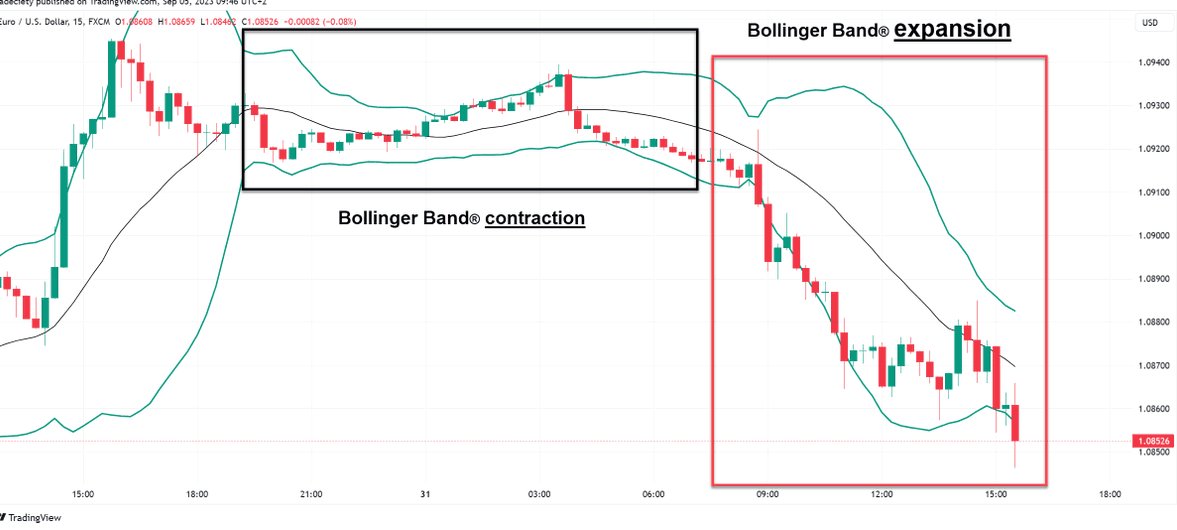
3.2 Bollinger Bands Bollinger Band contraction occurs when the bands tighten due to low volatility. Signals a period of consolidation. This often leads to a breakout, as volatility returns. The direction of the breakout can be assessed using volume or other indicators.

3.3 Bollinger Bands Bollinger Band expansion happens when the bands widen due to increased volatility. Breakouts during expansion are more reliable, especially with high volume, confirming the new trend. Expansion often follows a contraction, marking a possible breakout.
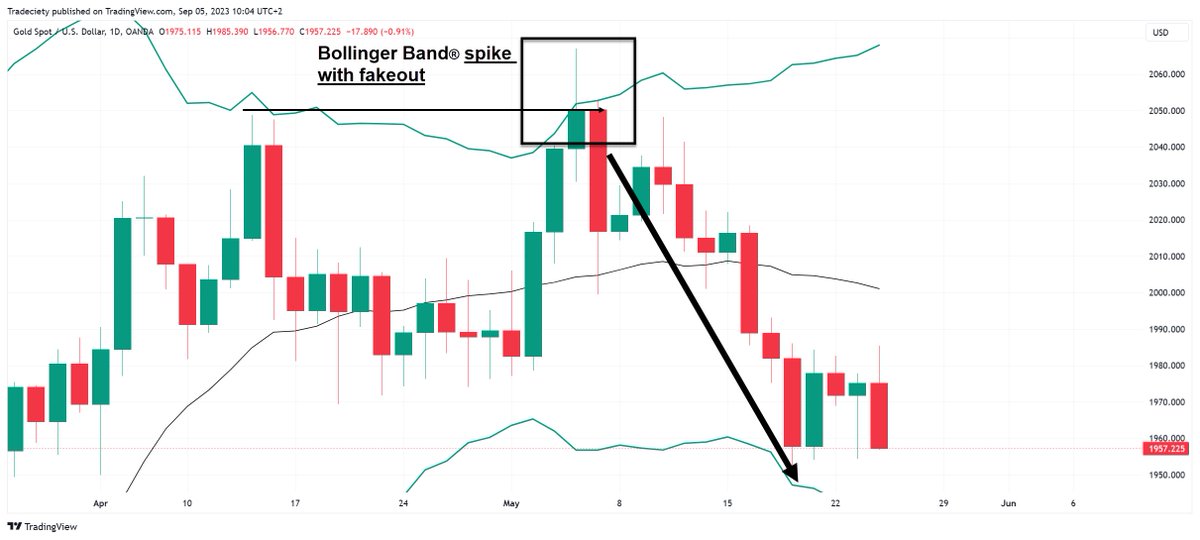
3.4 Bollinger Bands When price breaks above the upper band or below the lower band but quickly reverses, it’s a fakeout. The bands widen, signaling increased volatility, but no follow-through. Watch for low volume or weak confirmation, signaling the move may not last.
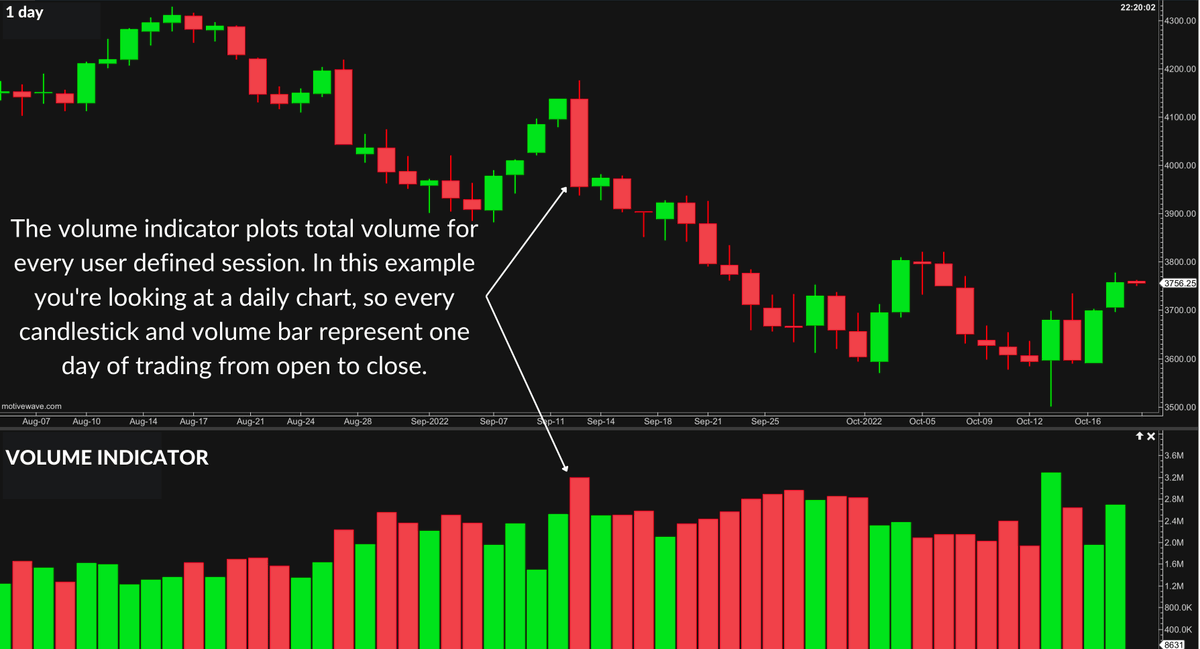
4. Volume Trading volume is the total number of shares or contracts traded during a specified period. When trading stocks, volume will be expressed in shares. When trading derivatives such as index futures, volume will be expressed in contracts
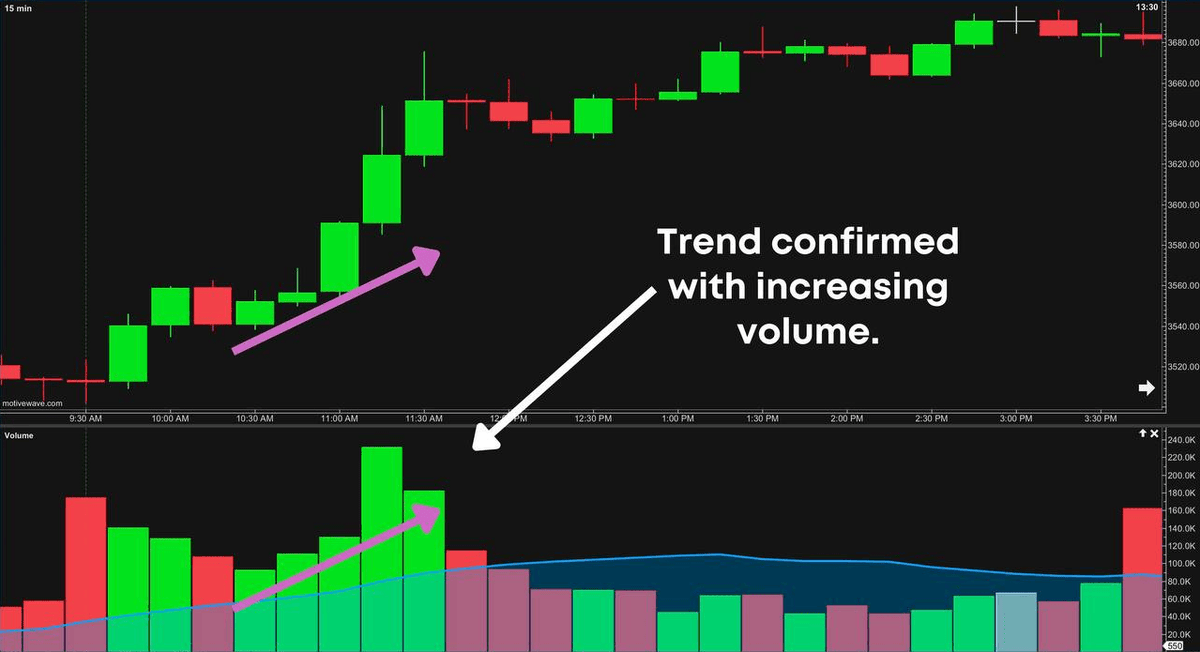
4.1 Volume Volume confirms trends • Rising volume + price increase = Strong buying interest • Rising volume + price drop = Strong selling pressure • Low volume = Weak or uncertain trend • Volume spikes = Possible breakout or reversal ahead
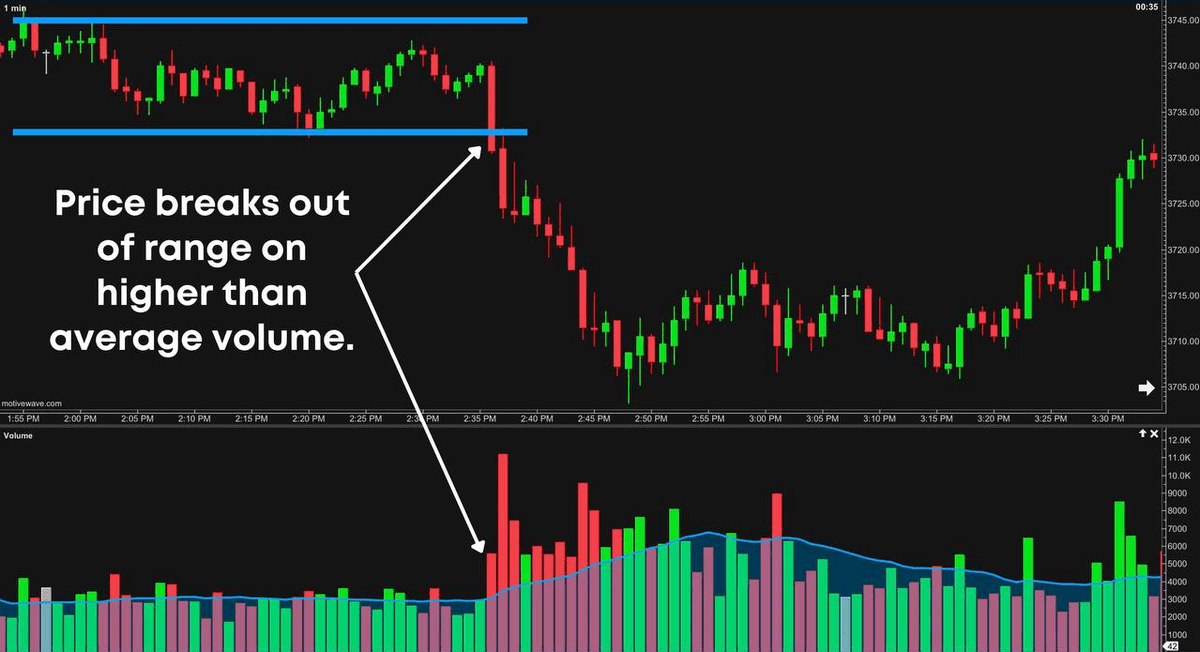
4.2 Volume Breakouts and volume: • Breakout + high volume = Strong confirmation of the move • Volume above average shows market conviction, supporting the breakout • Breakout + low volume = Weak signal, often leading to a false breakout
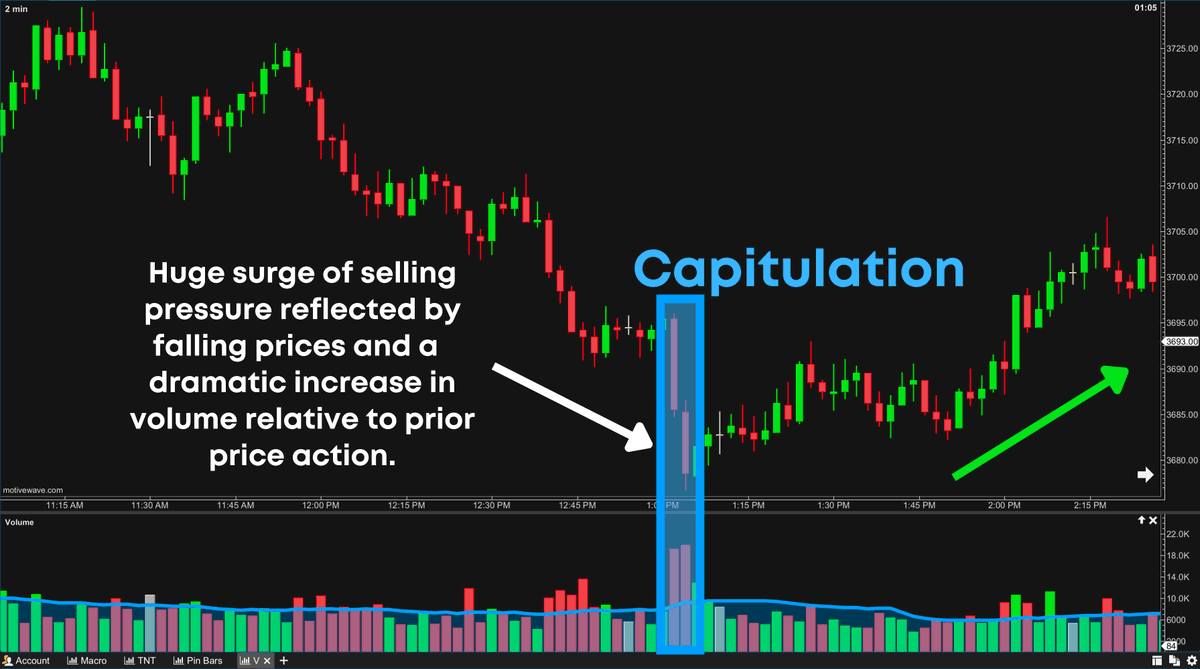
4.3 Volume Capitulation is a dramatic surge of buying pressure in a rising market or selling pressure in a declining market Capitulation can mark the end of a trend as those who didn’t exit during the panic, are unlikely to exit after price settles
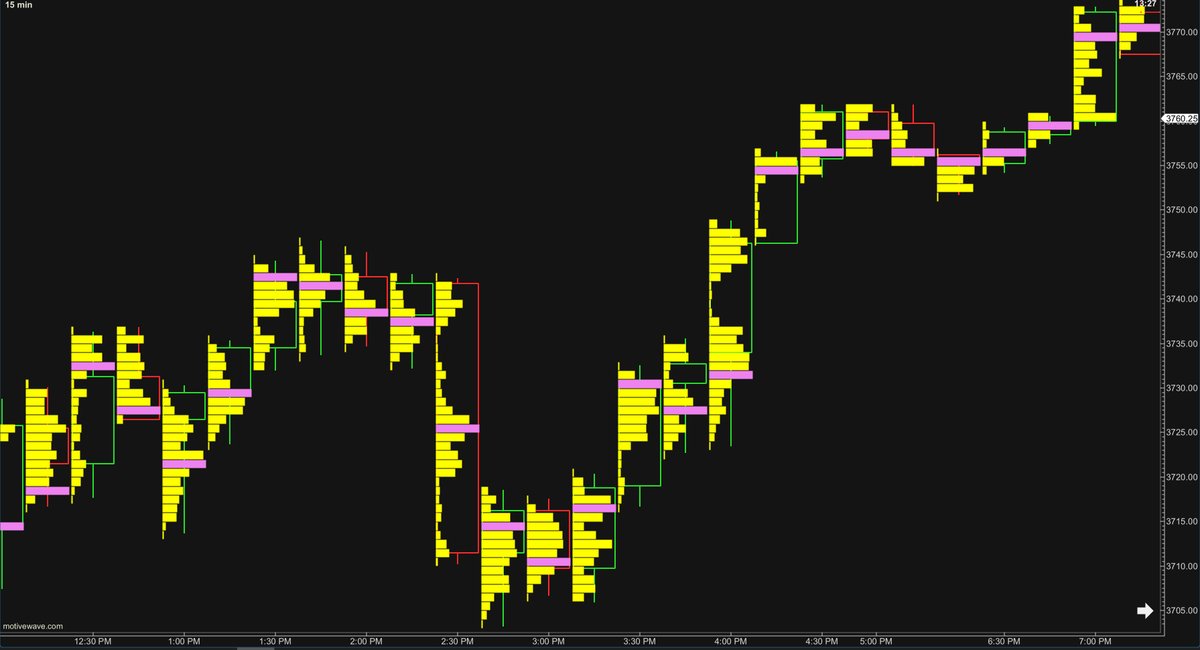
4.4 Volume Volume Profile is a visual tool that shows how much volume was traded at each price level. High volume areas act as strong support/resistance. Low volume areas indicate zones where price moves fast traders use it to spot key levels and validate trends.