In this THREAD I will explain “Liquidity” 1. Where is the Liquidity? 2. Liquidity Sweep 3. Premium and Discount 🧵(1/15)

1. Where is the Liquidity? Liquidity concentrates around Order Blocks and Breaker Blocks, where institutional orders accumulate. Order Blocks define Supply and Demand zones. Breaker blocks signal control shifts, highlighting liquidity pools

1.1 Where is the Liquidity? Order Blocks are price zones where institutions place large orders. These areas often cause strong price reactions and can signal key support or resistance levels. They form when a strong move follows a period of consolidation
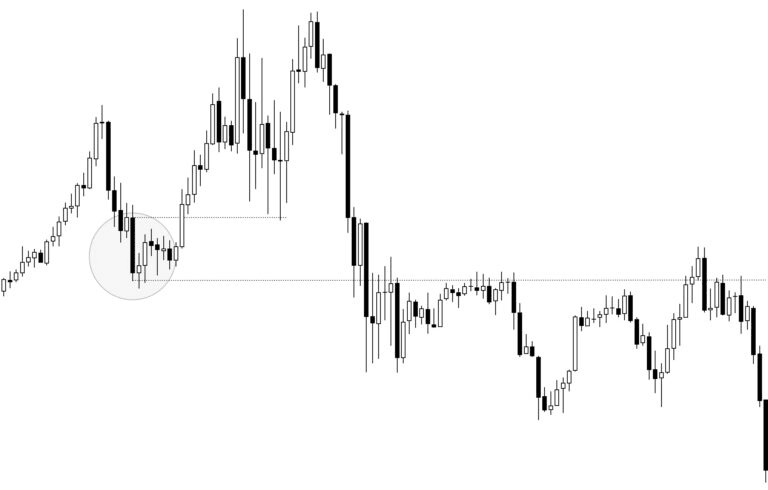
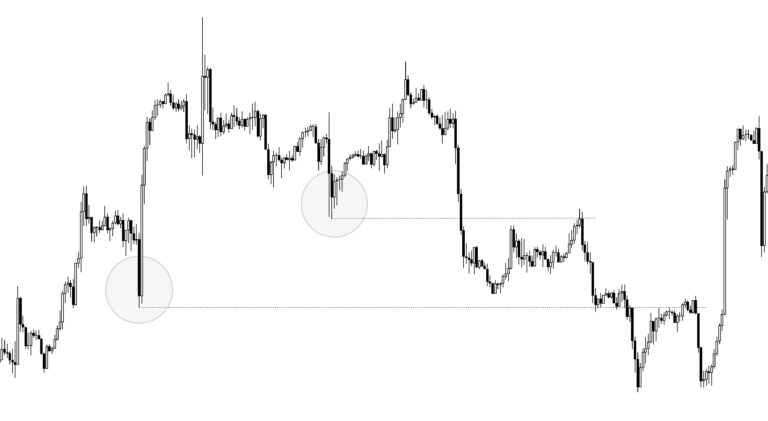
1.2 Where is the Liquidity? This is a Bullish Breaker. In the circled area you can see price breaking below the prior support level (the dotted line) Then subsequently coming back up to “fill” that broken area before the big rally.
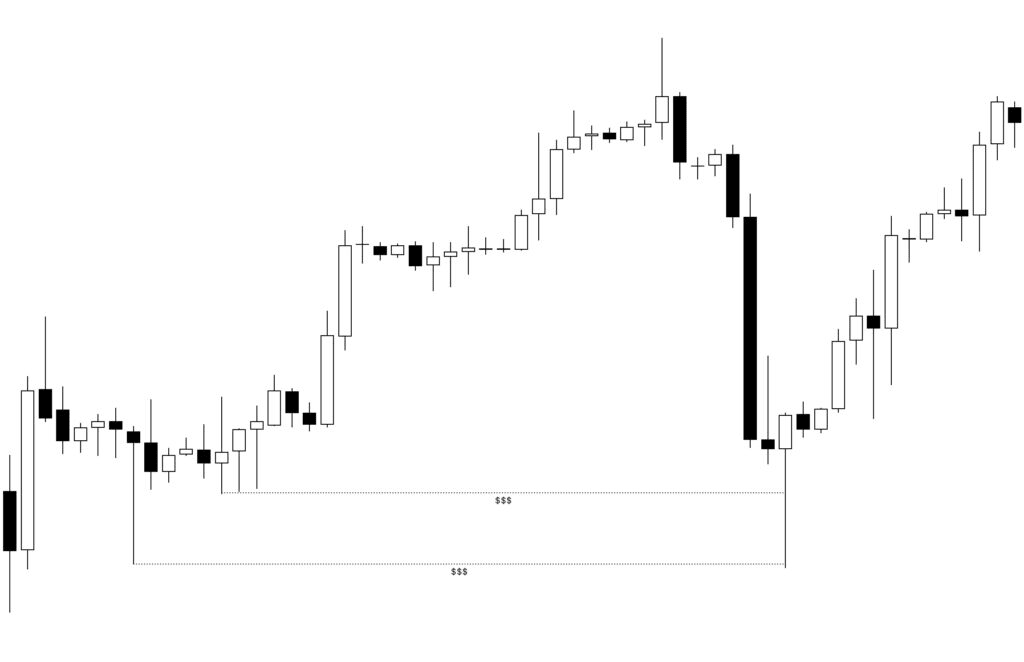
1.3 Where is the Liquidity? A High Probability Bullish Order Block acts as support, pushing prices higher. However, if it fails, it becomes a Bearish Breaker. Now resisting price movement and pushing it downward.
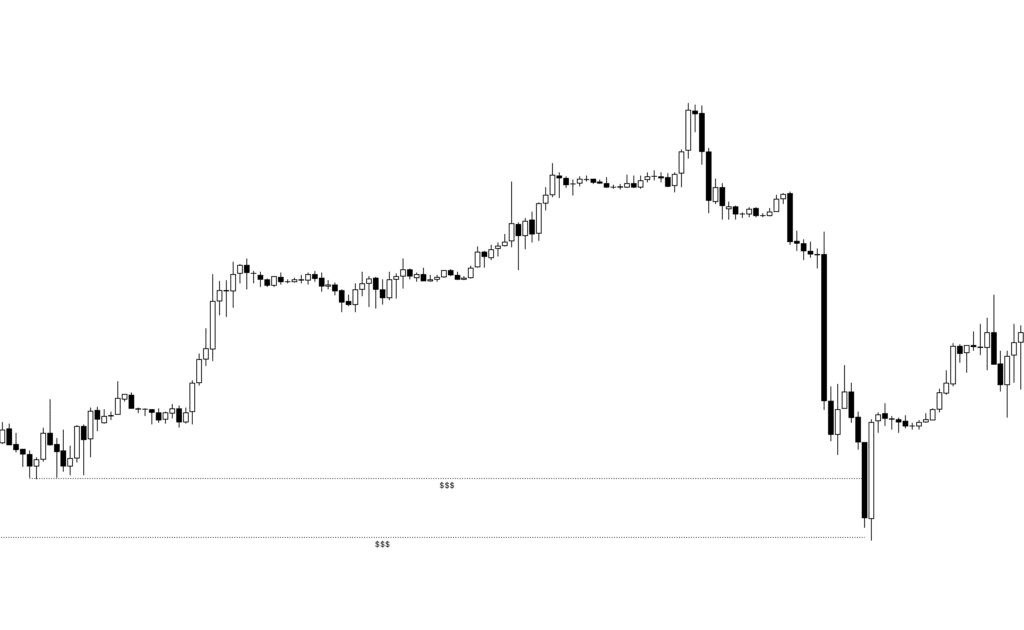
2. Liquidity Sweep A Liquidity Sweep occurs when price temporarily moves beyond a key level, such as a previous Swing High or Low, to trigger Stop Loss. This lure breakout traders into bad positions before reversing in the opposite direction.
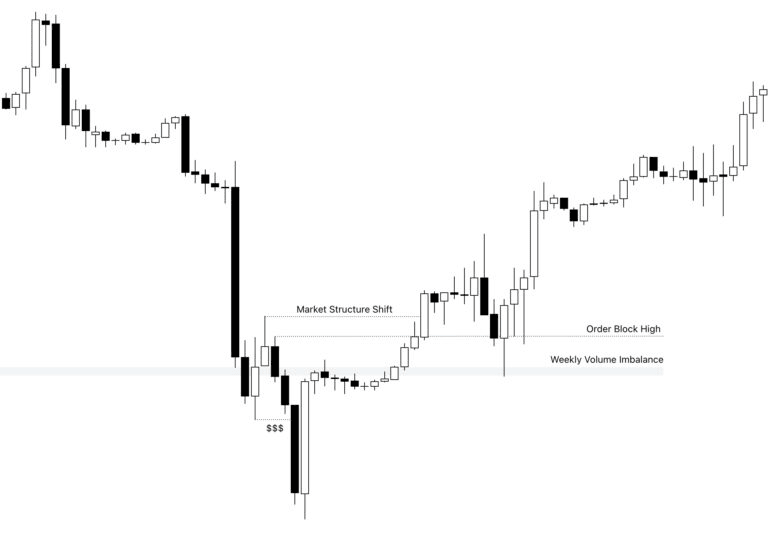
2.1 Liquidity Sweep A Market Structure Shift occurs when price decisively breaks and holds beyond a prior swing high or low. Signaling that the existing trend has changed direction and underlying supply–demand dynamics have flipped.
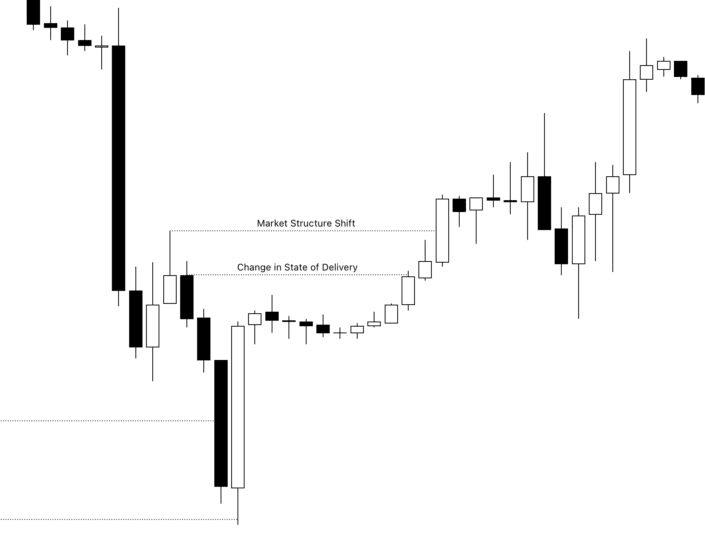
2.2 Liquidity Sweep After the strong price move, the formation of a FVG represents a gap between the previous fair value and the new price.
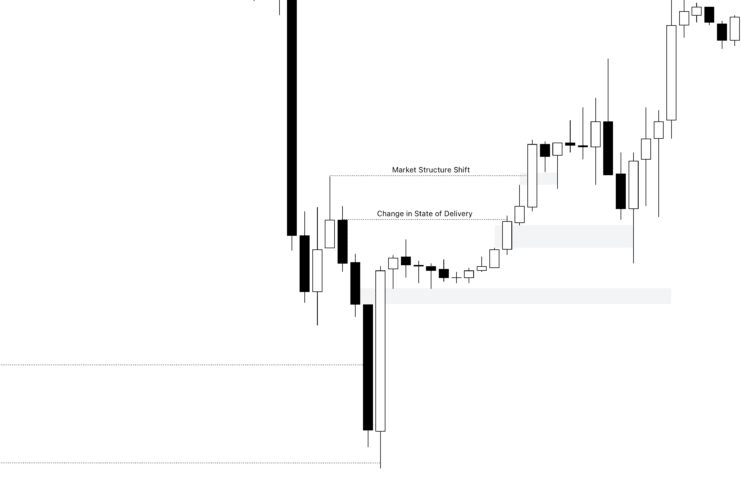
2.3 Liquidity Sweep - Has the order flow reached an institutional level? - Did the price sweep liquidity? - Did the price result in a CSD? - Did the price cause a Market Structure Shift? If the answer is yes, it indicates that a high-probability Order Block has formed.
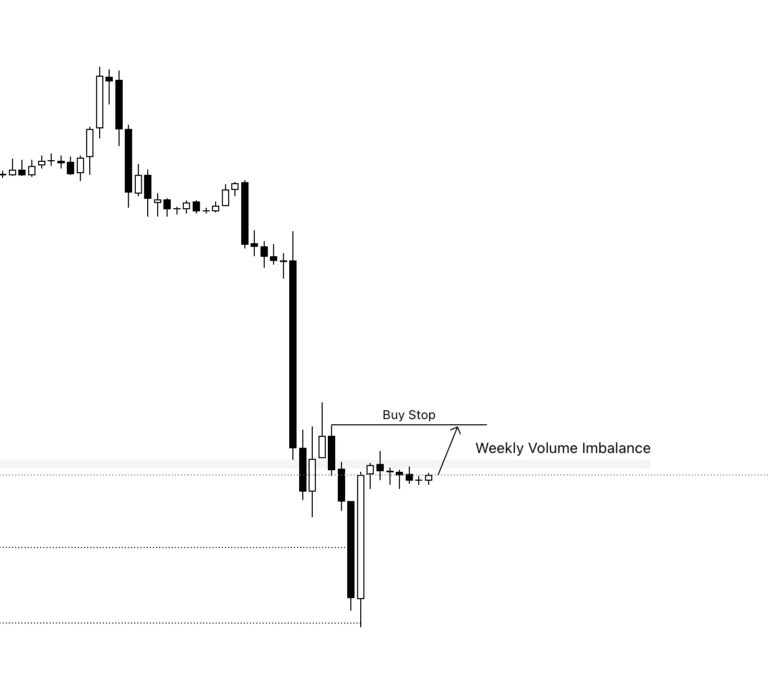
2.4 Liquidity Sweep For a Bullish Order Block, a trader can take an aggressive entry by placing a buy stop order at the high of the bearish candles. In anticipation of the OB formation.
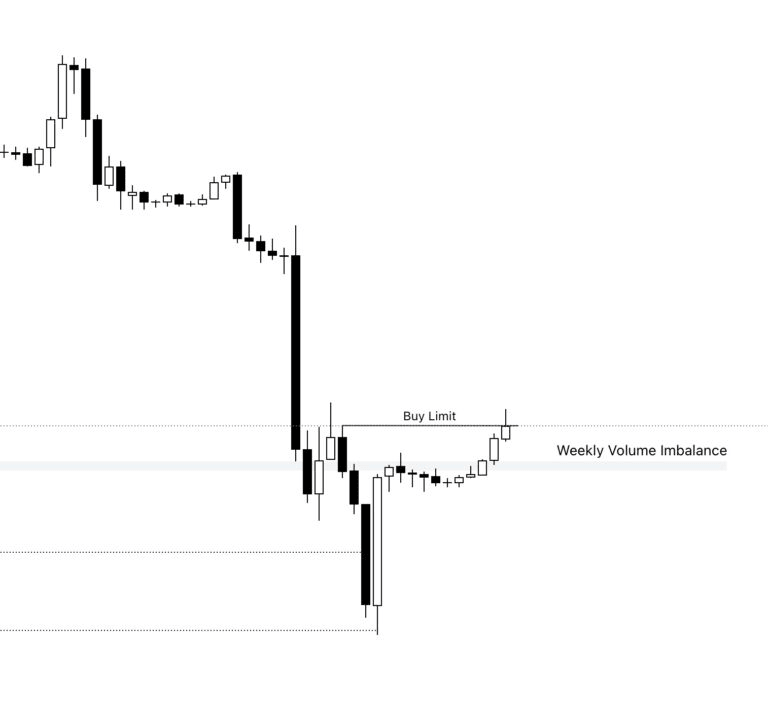
2.5 Liquidity Sweep A less Aggressive approach is to wait for the price to break above the High of the Bearish candles. Then place a buy limit order at the High of the bearish candles with the expectation that price drops back and tap the high before continuing higher.
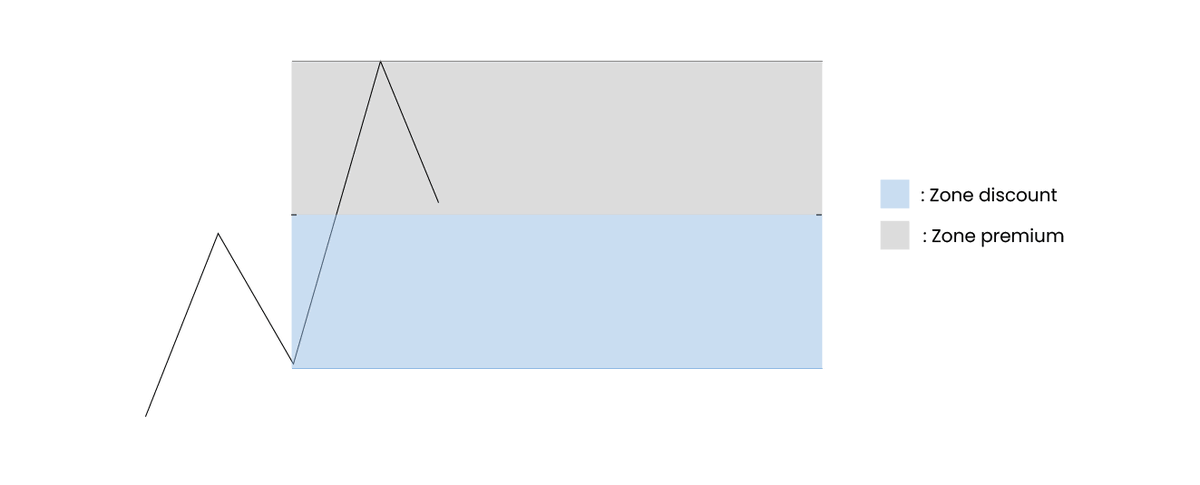
3. Premium and Discount Premium zone: price above fair value (above VAH or bearish order block), viewed as expensive. Ideal for short entries. Discount zone: price below fair value (below VAL or bullish order block), viewed as cheap. Ideal for long entries.
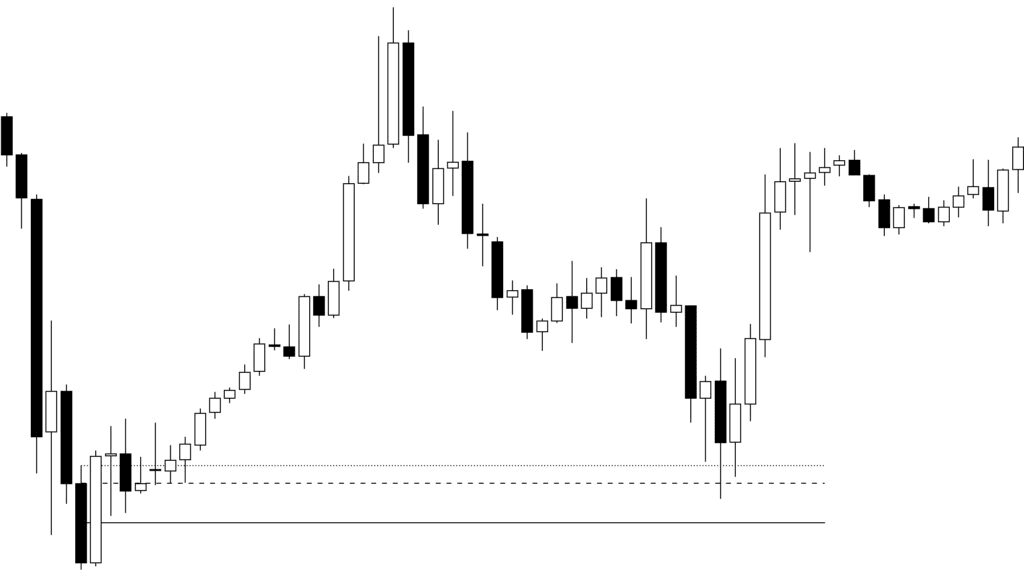
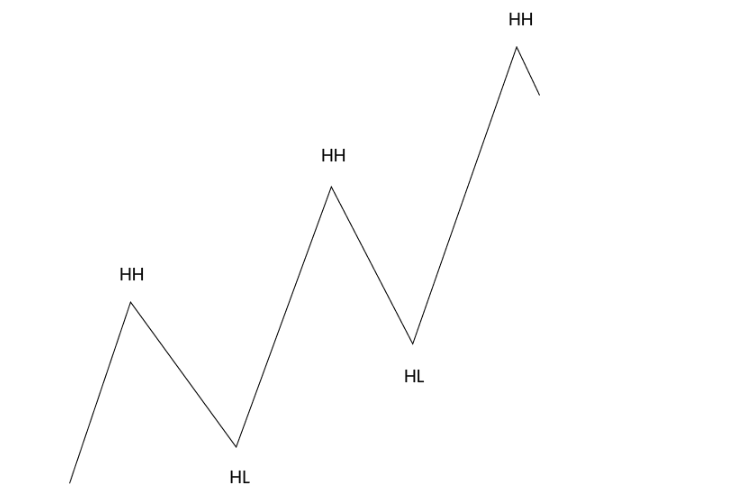
3.1 Premium and Discount Price makes HH/HL structure. After pullback to the last HL, the blue area marks the discount zone (below value) where a red POI offers a buying opportunity. The grey premium zone above value is overpriced for longs; red POIs there are weak.
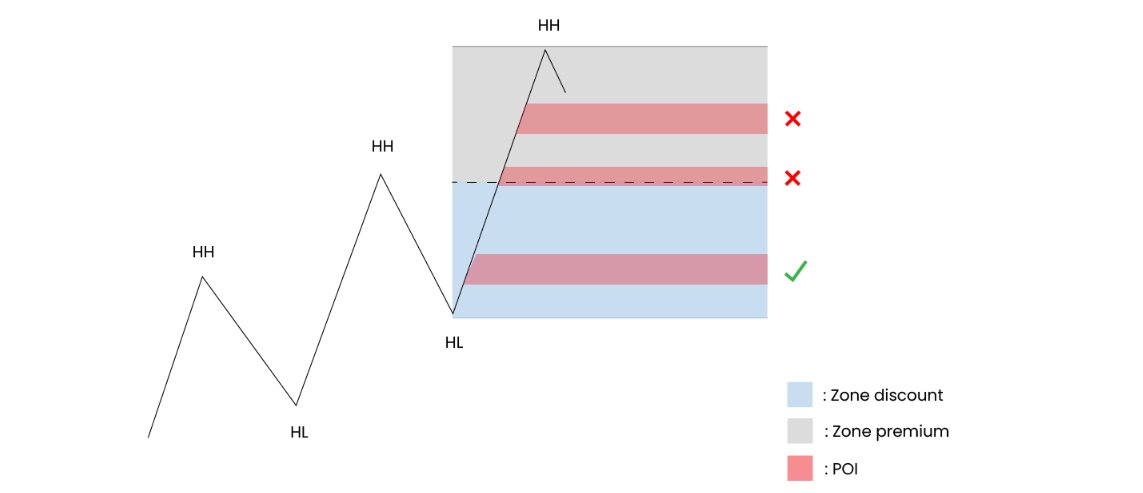
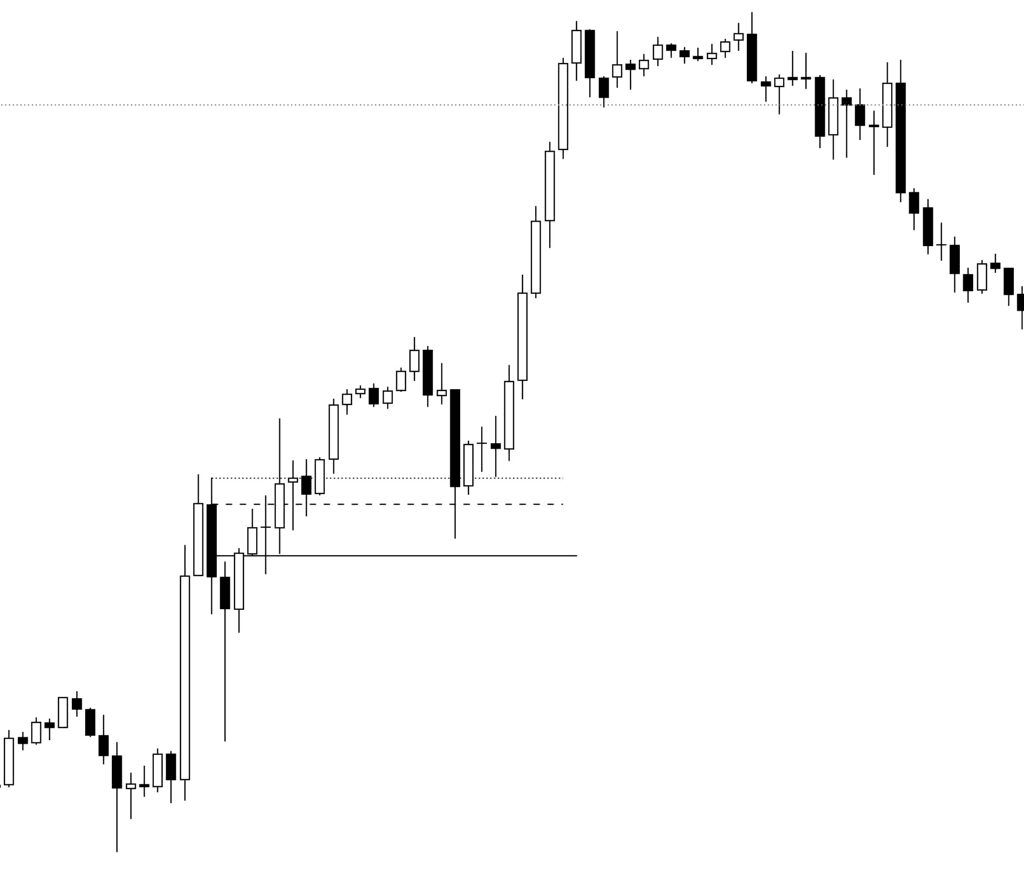
3.2 Premium and Discount In the image on the left, the price is bouncing back into the discount zone, which represents a buying opportunity. On the chart on the right, the premium/discount zone has been wrongly positioned on the bearish retracement.

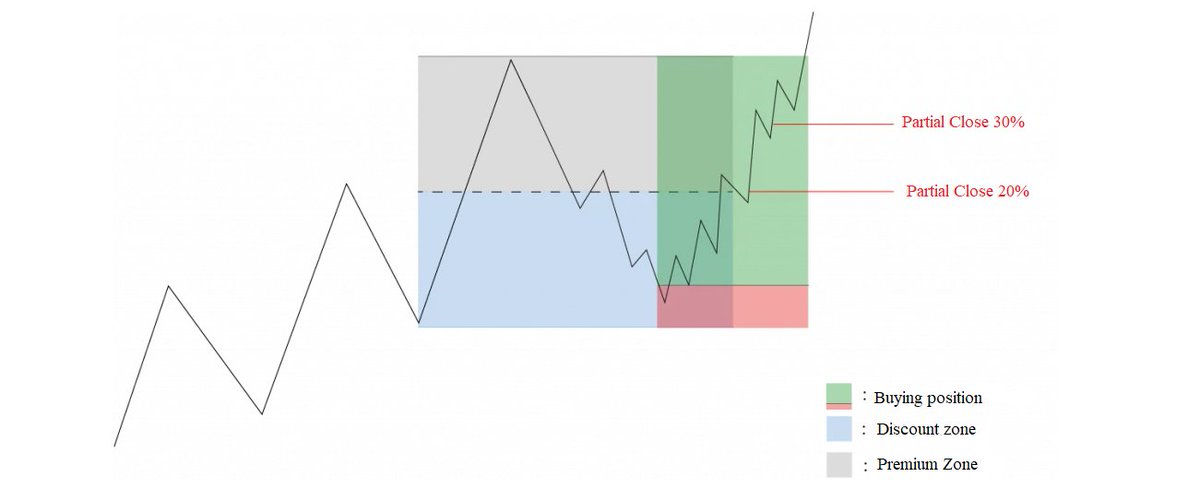
3.3 Premium and Discount Price oscillates between Discount and Premium Zones. Strategic entries are executed in the Discount Zone. While partial profits of 20% and 30% are secured as price advances into the Premium Zone.