In this THREAD I will explain "Market Structure" 1. What is Market Structure? 2. Order Block 3. Rejection Block 🧵(1/13)

1. What is Market Structure? Market structure is classified into 2 trends: Uptrend (Higher Highs and Higher Lows) Each new High and Low is higher than the previous one Downtrend (Lower Highs and Lower Lows) Each new High and Low is lower than the previous one


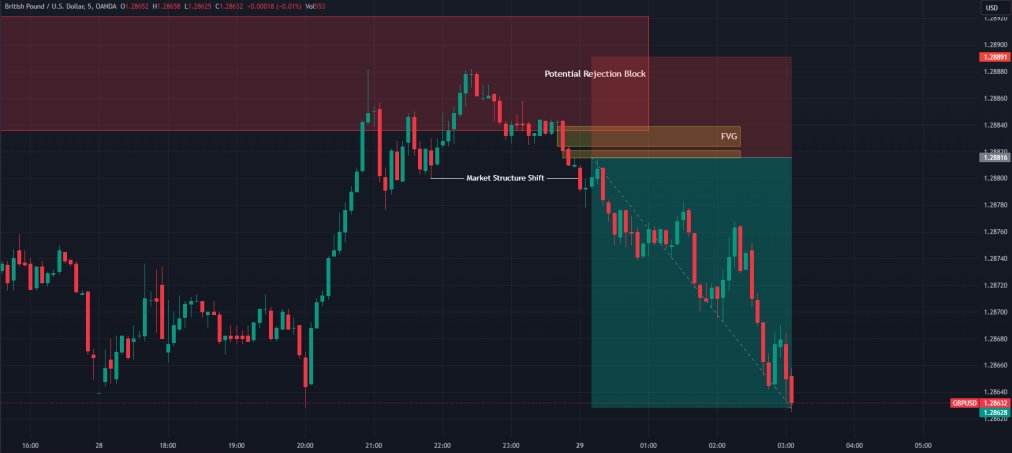
1.2 What is Market Structure? Break of Structure turns a series of Higher Highs/Higher Lows into Lower Highs/Lower Lows. Marking a Market Structure Shift (MSS) A MSS happens when a price breaks past a Swing high or Low with a full-bodied candlestick, signaling a reversal
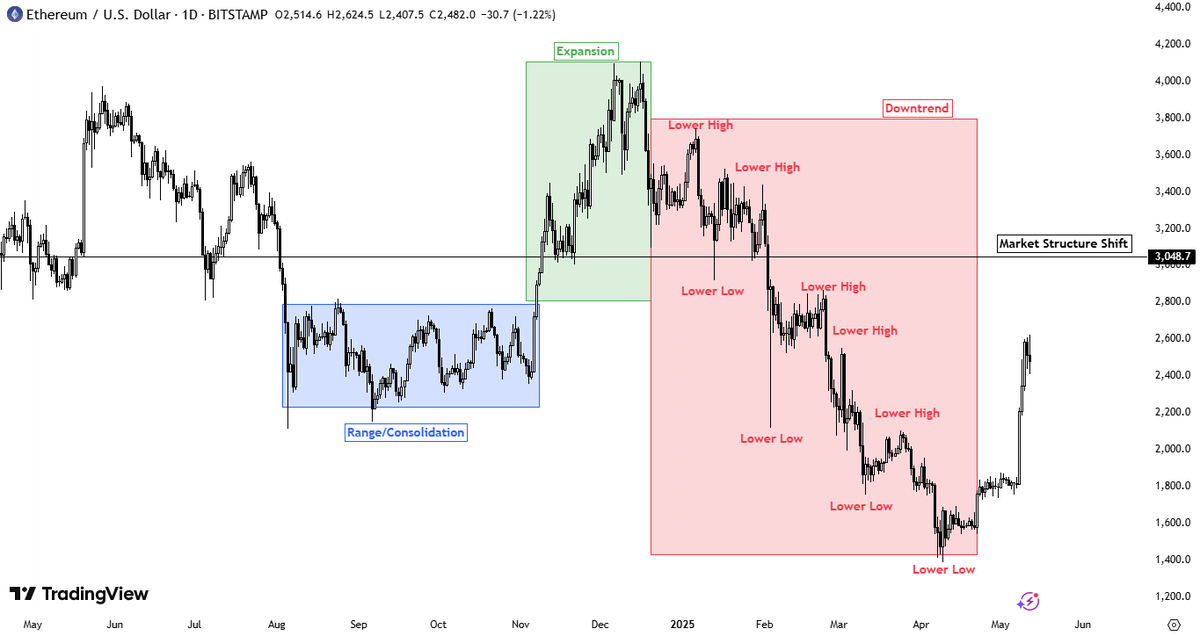
1.3 What is Market Structure? ChoCh is a local signal of a trend reversal, which may be temporary or indicate a new trend. In contrast, a Market Structure Shift (MSS) appears on the chart as a more significant impulse, confirming the actual change in trend.

1.4 What is Market Structure? Break of Structure (BOS) occurs when the price of an asset moves beyond a Swing Lows or Swing Highs In a downtrend, Break of Structure means a bearish trend continuation. In a uptrend, Break of Structure means a bullish trend continuation.

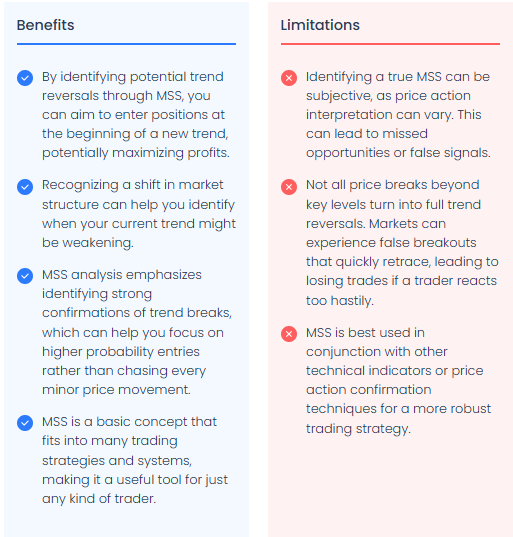
1.5 What is Market Structure? BOS confirms strength in the current trend, while MSS warns of a possible reversal and new trend forming. These illustrations explain the benefits and limitations of both.

1.6 What is Market Structure A Breaker Block (BB) is an invalidated order block. When a bearish OB is invalidated, it turns into a bullish breaker block. When a bullish OB is invalidated, that zone turns into a bearish breaker block

2. Order Blocks Bullish order blocks occur in a bear trend, after which the price rises. A Bullish block of orders is defined by the last down (bearish) close candlestick followed by an up (bullish) close candlestick that goes above the previous bearish candle's high

2.1 Order Blocks A Bearish order block is a mirror situation. Buyers push the price up, but at a certain level, they meet with the corresponding order blocks of the sellers. Demand is satisfied, and the price returns to the opening level.

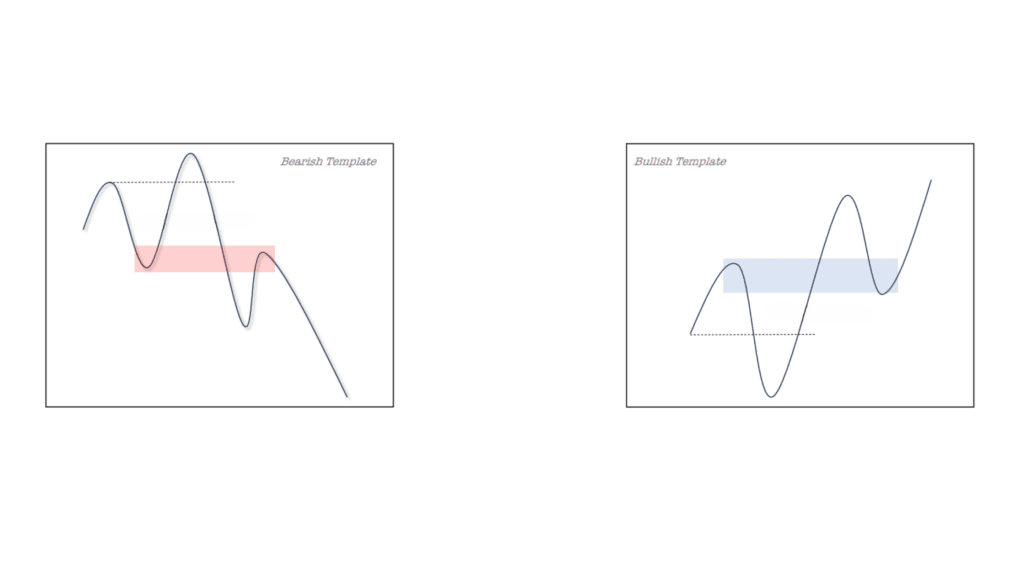
2.2 Order Blocks Order blocks are price zones where large orders clustered just before a strong move. In the bearish template the red block marks a supply zone (last rally consolidation) before a drop In the bullish template the blue block marks a demand zone before a rally.
3. Rejection Block A Bullish Rejection Block is a Demand zone where price revisits, holds support, then “rejection” wicks form as buyers step in. Signaling strong Demand and a likely upward move. Traders watch it for pullback entries.

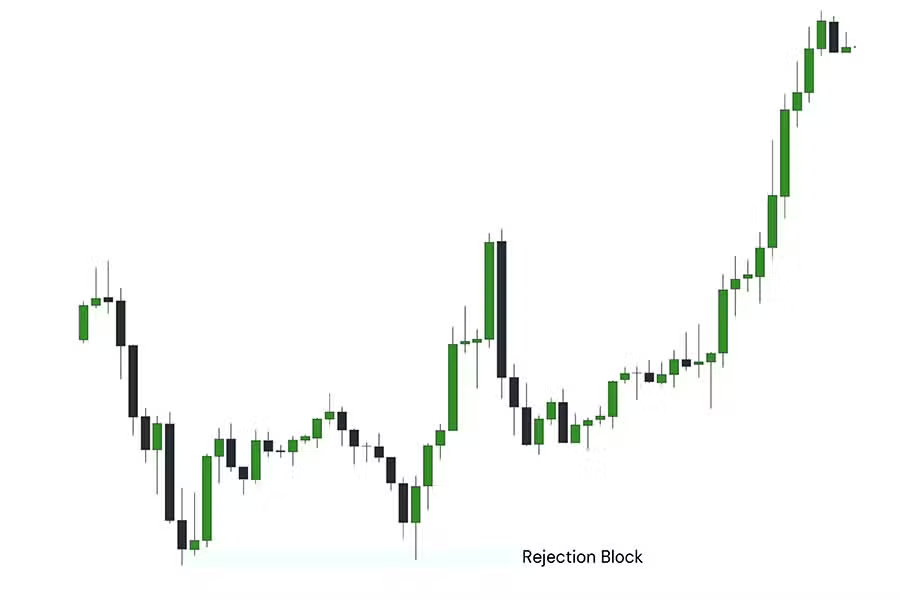
3.1 Rejection Block A Bearish Rejection Block is a Supply zone where price revisits, holds resistance, then “rejection” wicks form as sellers overwhelm. Signaling strong Supply and a likely downward move. Traders watch it for pullback short entries.

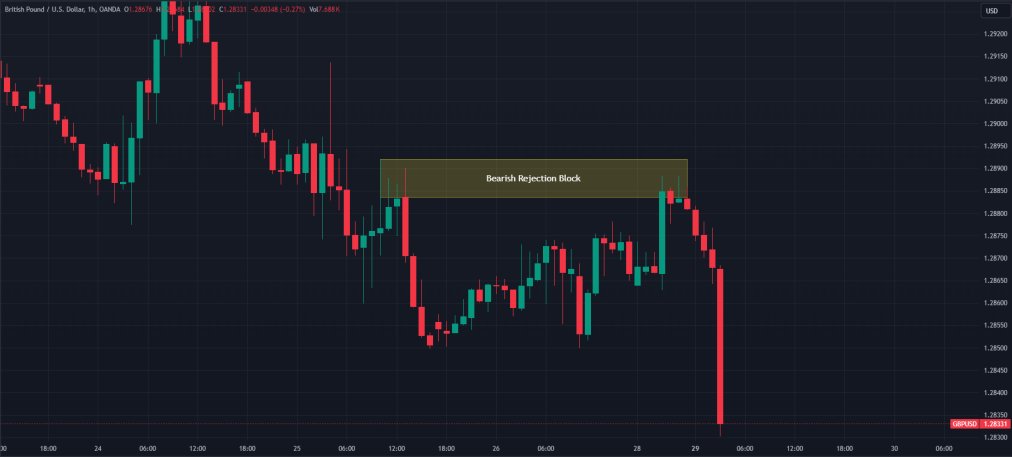
3.2 Rejection Block After you see price hitting a Rejection Block, and FVGs which are supporting the price get lost, short it. The entry trigger for this kind of trades, is when price does a Market Structure Shift. The current trend changes from Bullish to Bearish