
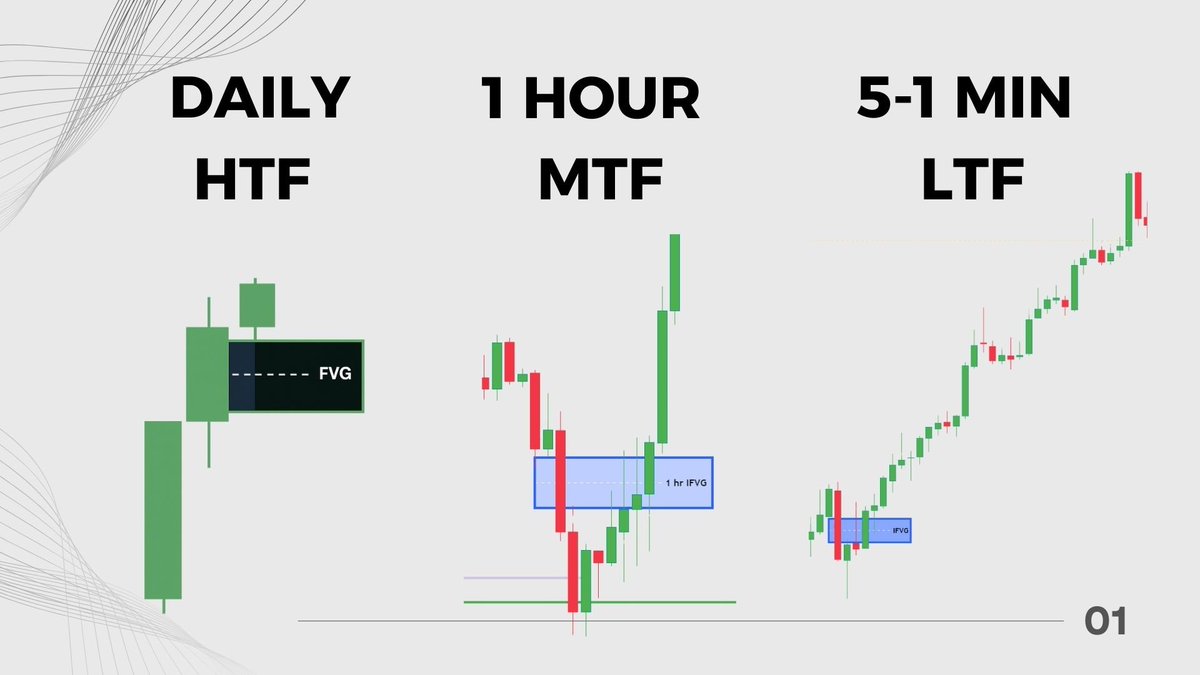
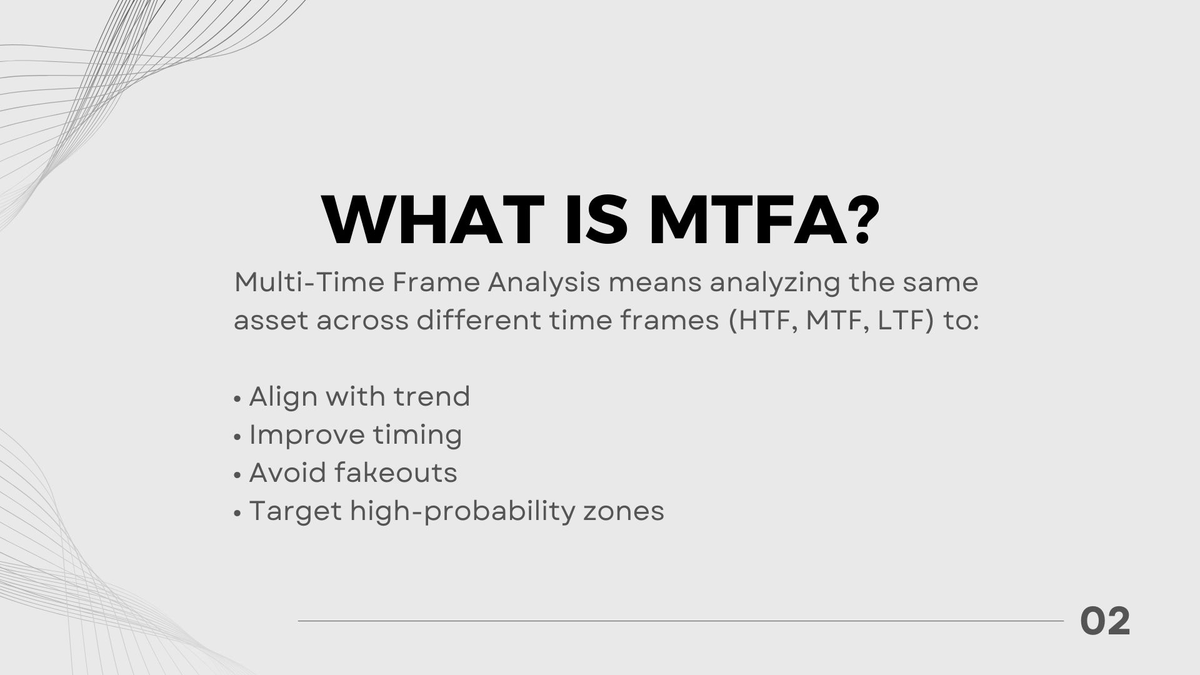
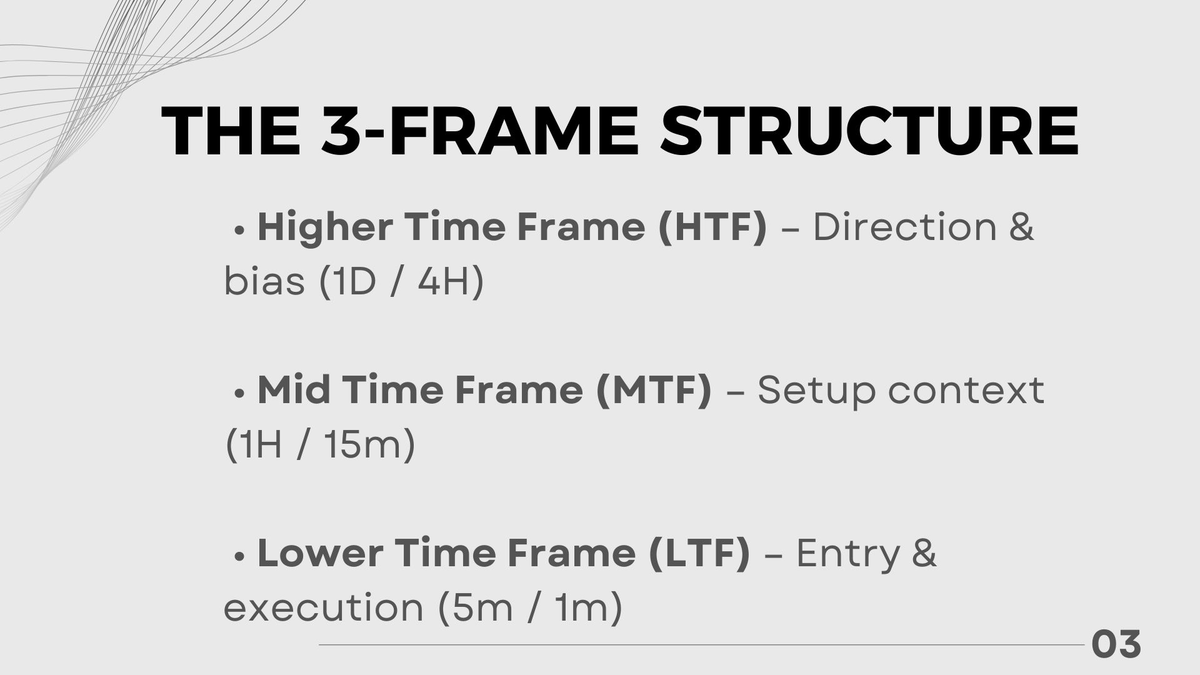
Struggling to sync your trades across time frames? This thread will teach you how to master multi-time frame analysis — step by step. 🧵👇

01.
02.
03.
04.
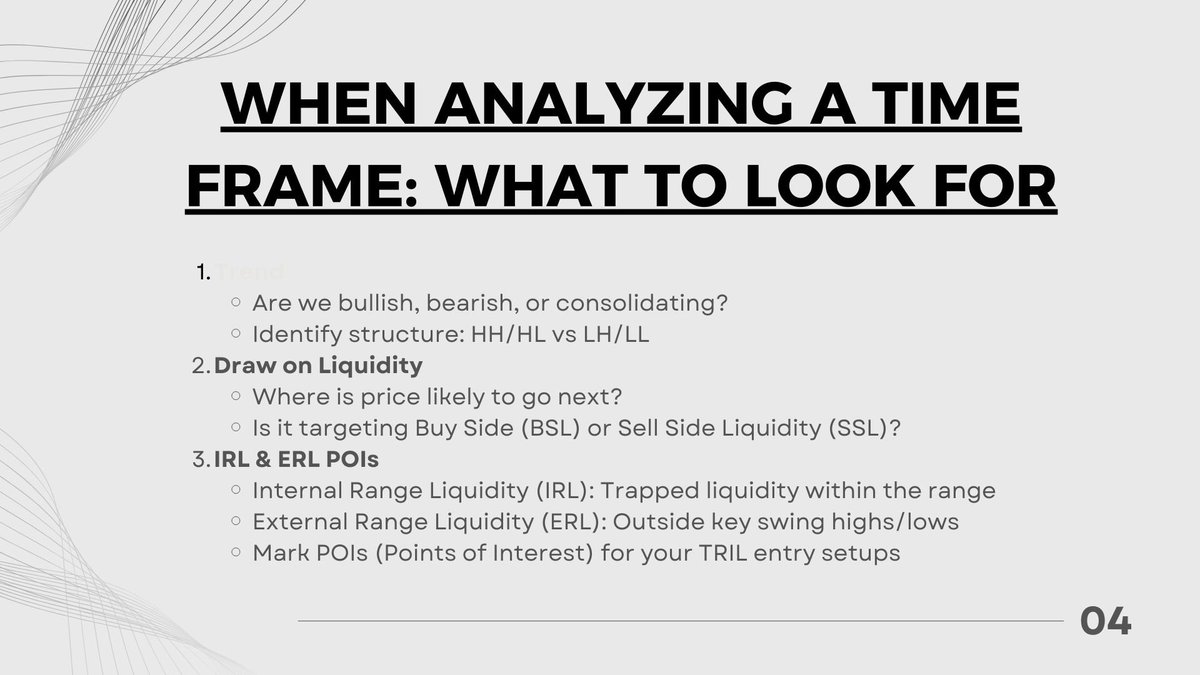
Let's apply all of this to a real chart
Let's start with the day chart. What do you see?
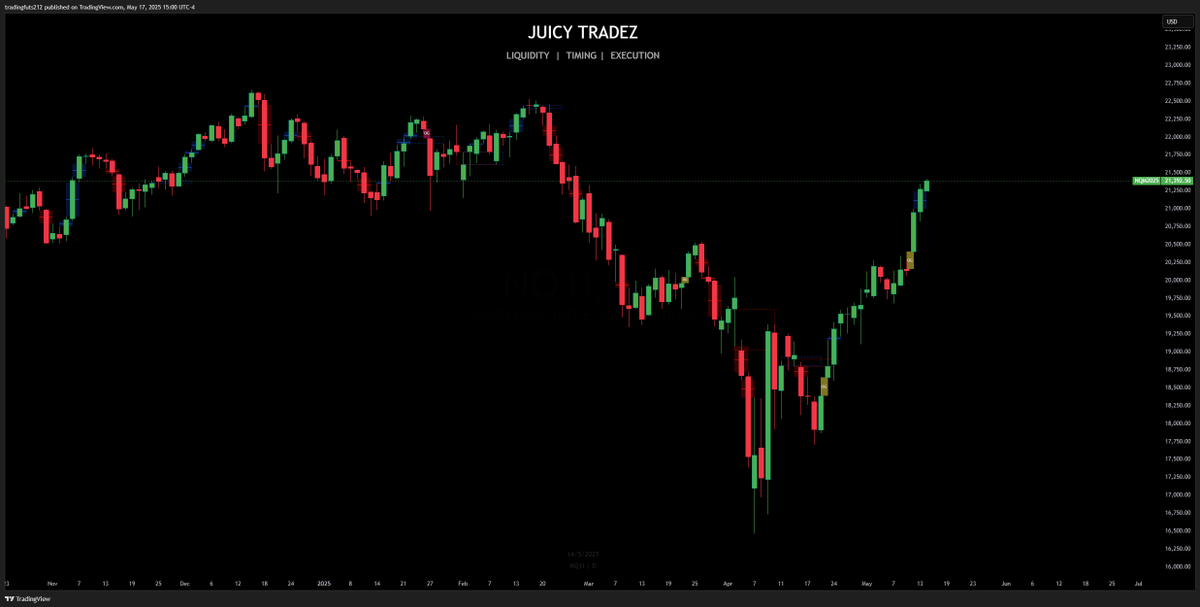
Here is the outline
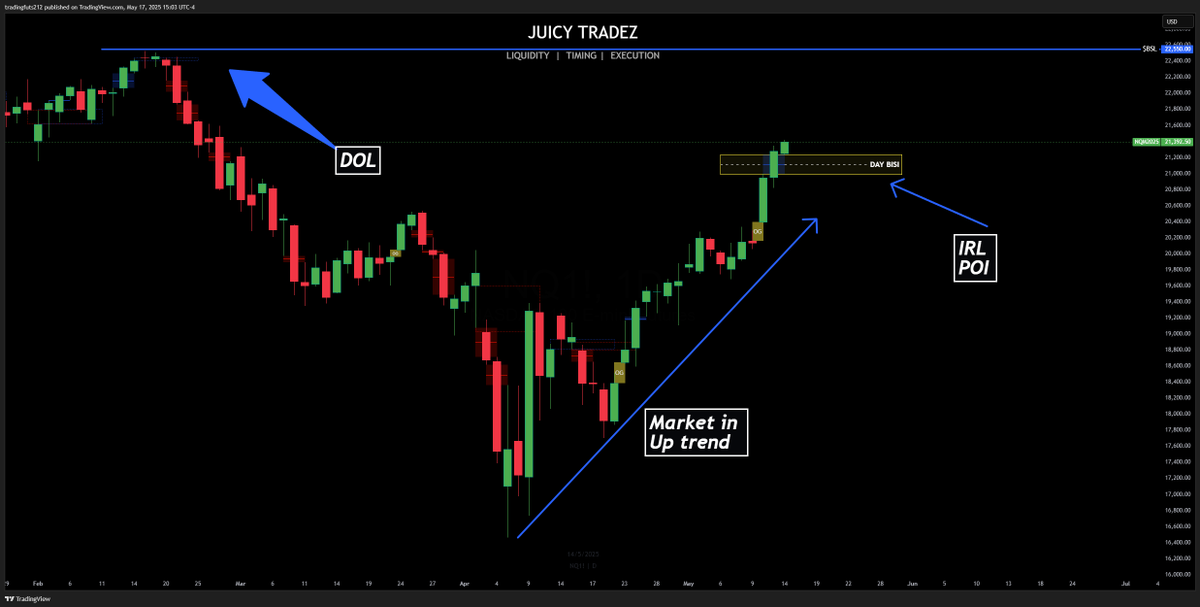
Drop down to the MTF time frame and keep the outline from the day chart.
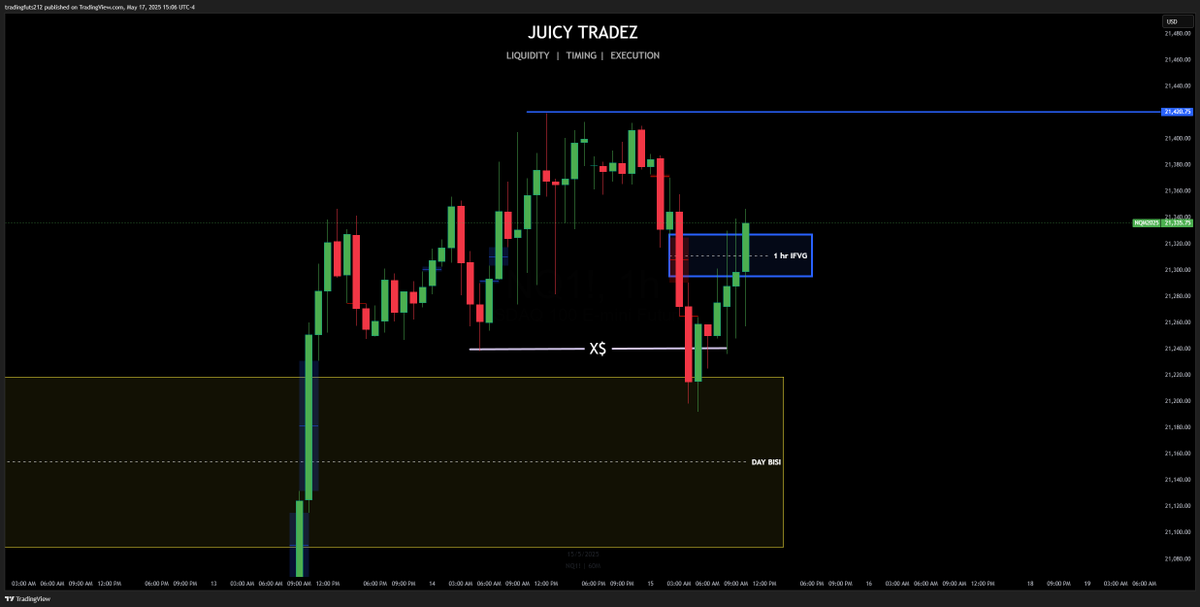
HTF is bullish. On the MTF, price taps HTF IRL + runs SSL — all while maintaining an uptrend. That sweep gives us our new ERL and confirms the high as the next TGT. Liquidity fuels direction. Know your narrative.
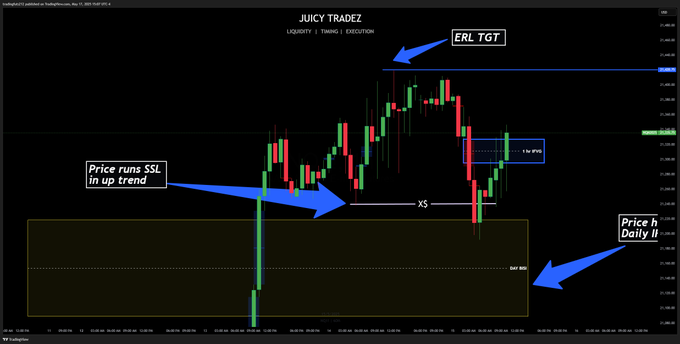
Now that you know where price wants to go, drop down to the 5M or 1M and find your entry model
Now that both the HTF and LTF are clearly bullish, our job is simple: Wait for the TRIL model to deliver price to the 1HR ERL target. This is a live trade we took using TRIL—precision, timing, and execution.

If this thread brought you value, tap in with us. We trade TRIL live every day. Get trade alerts, livestreams, mentorship & more. Join the free Discord: https://discord.gg/uvsx2hr8gz