In this THREAD I will explain “Liquidity” 1. FVG 2. IFVG 3. Supply and Demand Zone 🧵(1/17)

1. FVG A FVG is a price gap that occurs when there's a noticeable difference between the closing price of one candle and the opening price of the next. Is useful to detect market inefficiencies or imbalances.


1.1 FVG FVGs appear when a significant price move leaves some orders unfulfilled, preventing traders from buying or selling an asset at a price they wanted Such moves usually occur when a market sentiment experiences a sudden significant shift or somebody places a large order
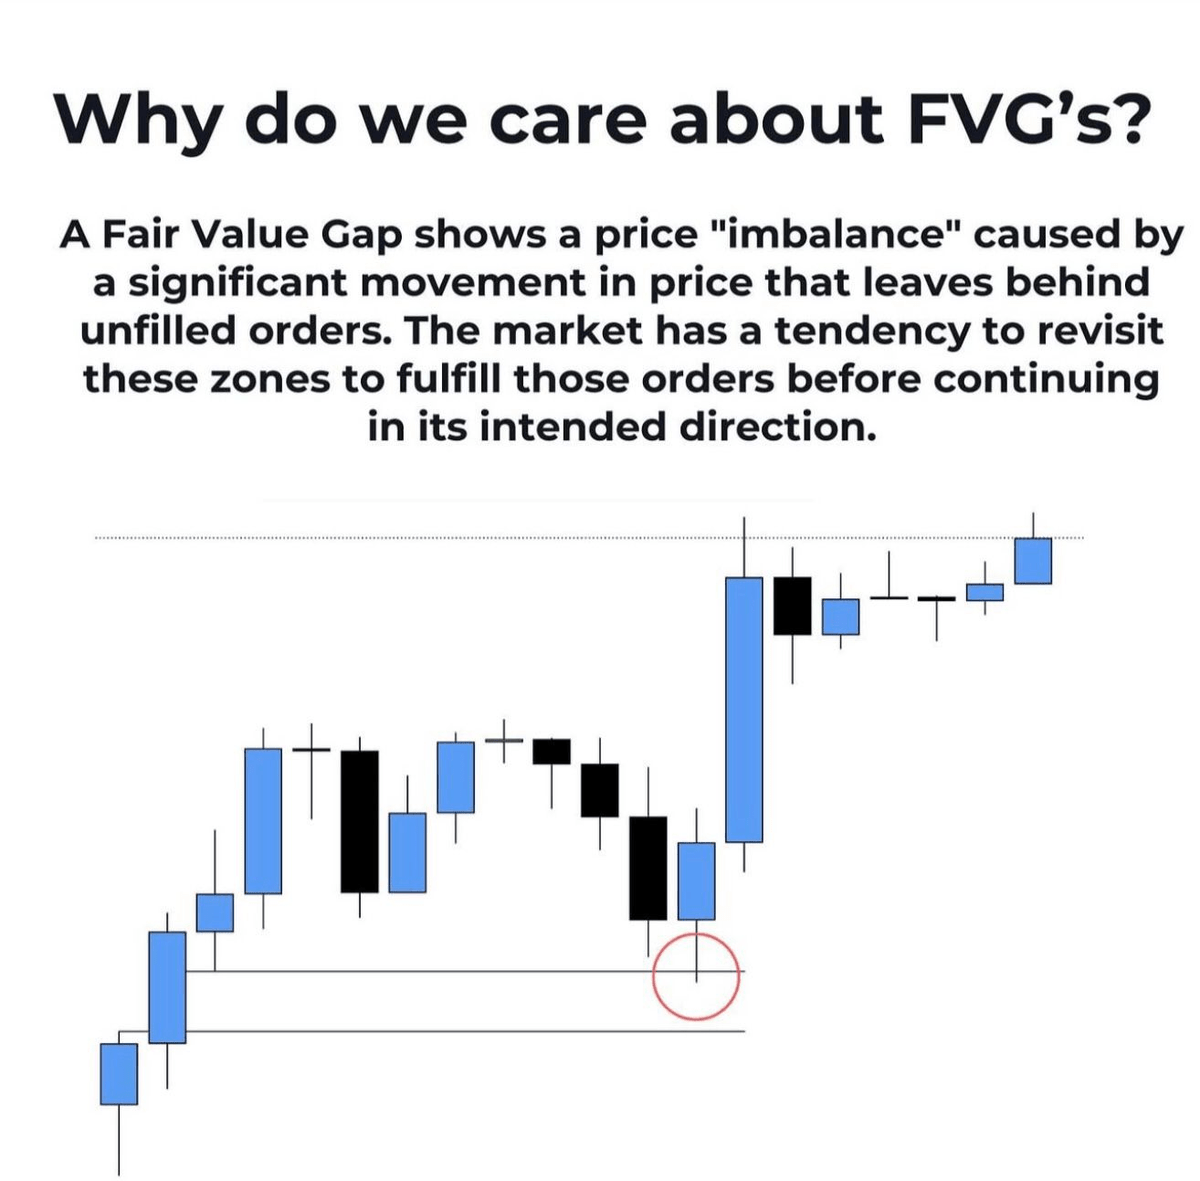
1.2 FVG Draw a line from the highest point of the preceding candle and the lowest point of the following candle. The space between these two points is your bullish fair value gap.


1.3 FVG I will explain 4 ways we can use the FVGs. - DOL on Liquidity - Continuations - Entries - Reversals
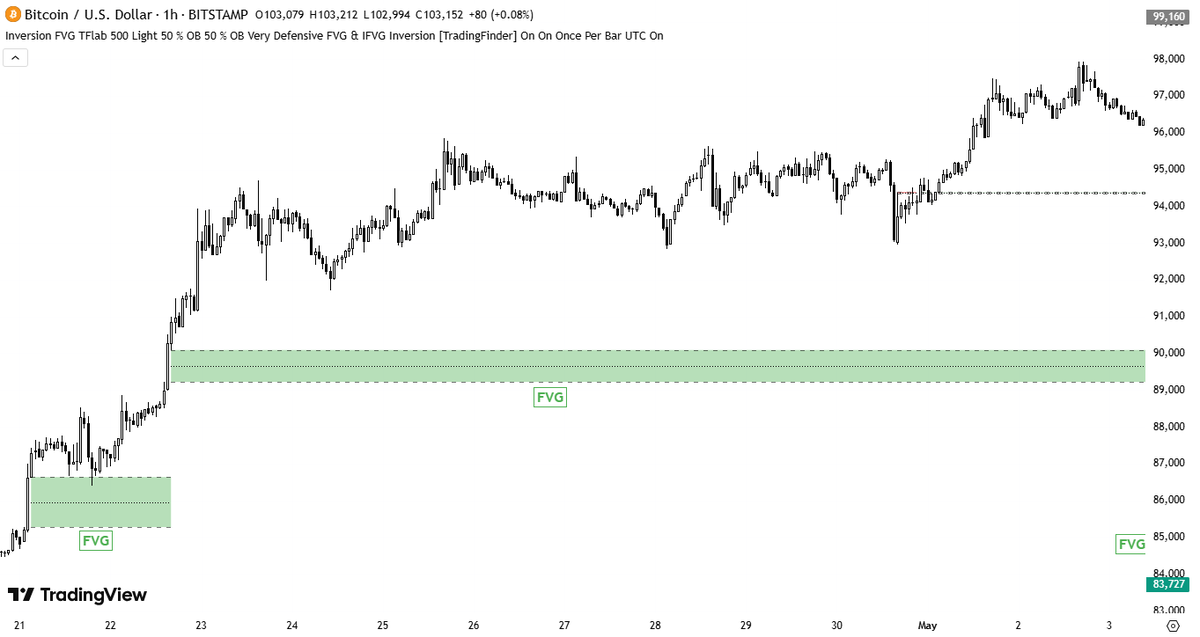
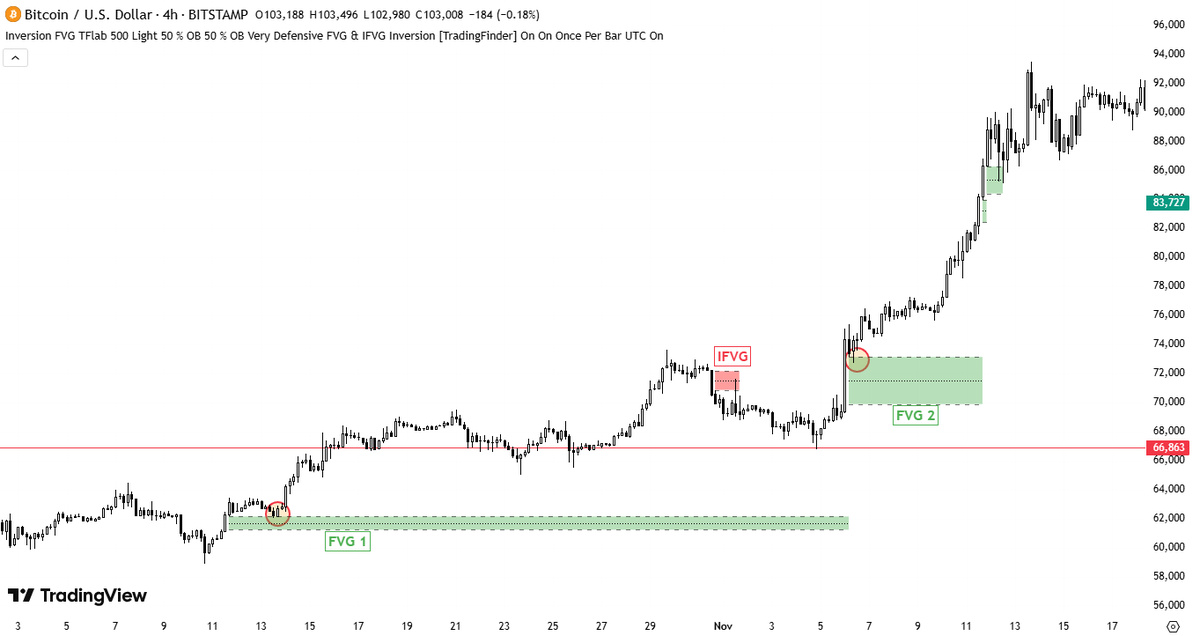
1.4 FVG Use this imbalances to predict where the price might return to take Liquidity. Price normally wants to fill FVG before a continuation higher

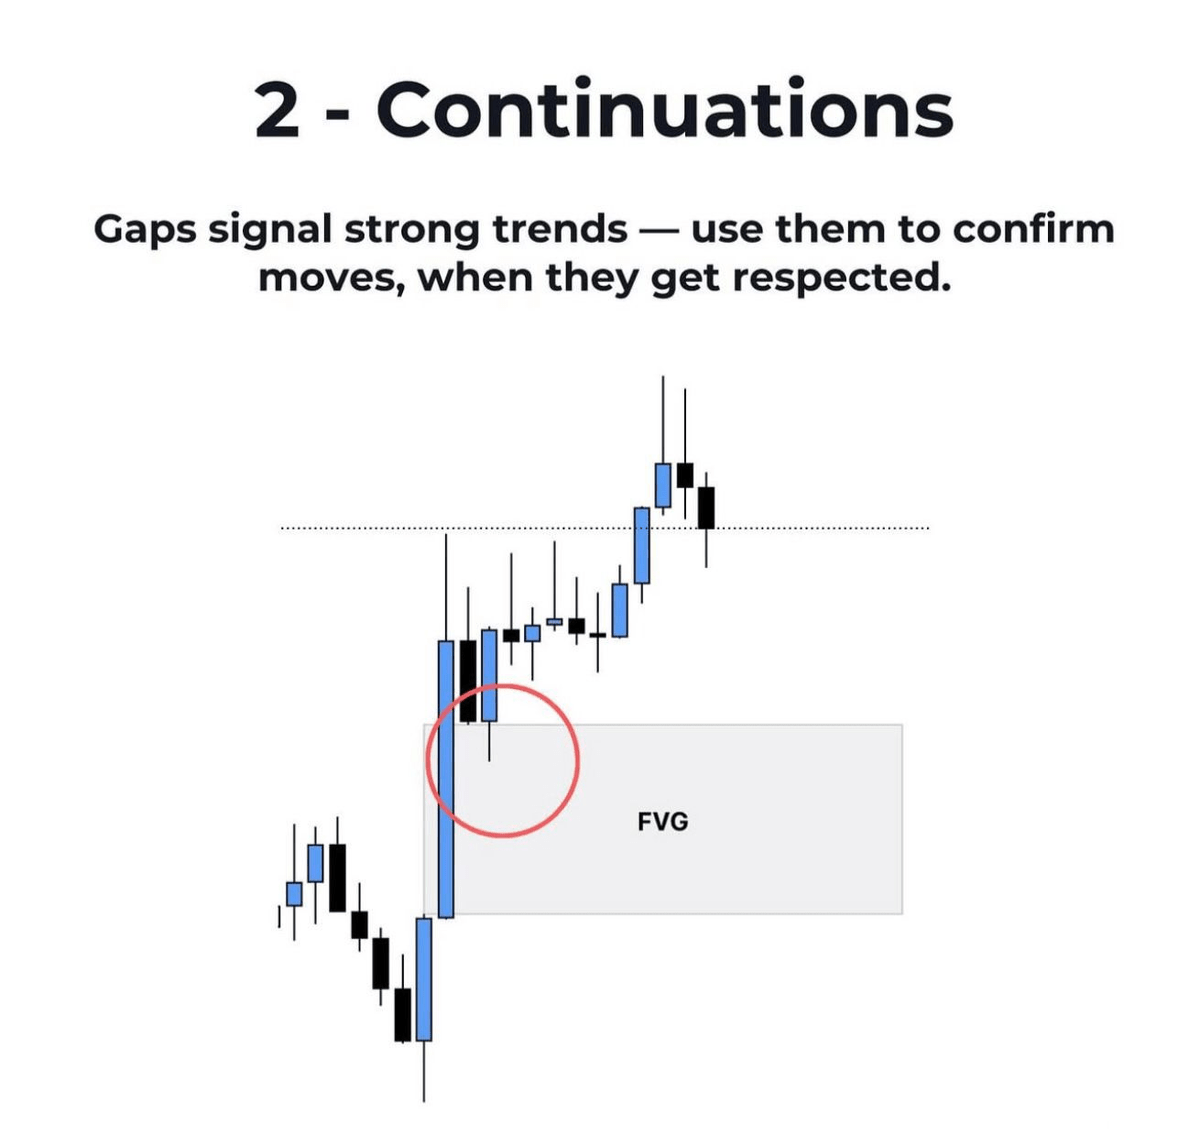
1.5 FVG This FVG acts as a continuation signal, confirming that the trend is likely to persist. Traders often use Volume and FVG to gauge the strength of the trend
1.6 FVG The most effective strategy for trading FVG is to buy or sell an asset when the market price deviates significantly from its fair value. Traders can use various indicators to identify potential trading opportunities and set stop-loss orders to manage their risk

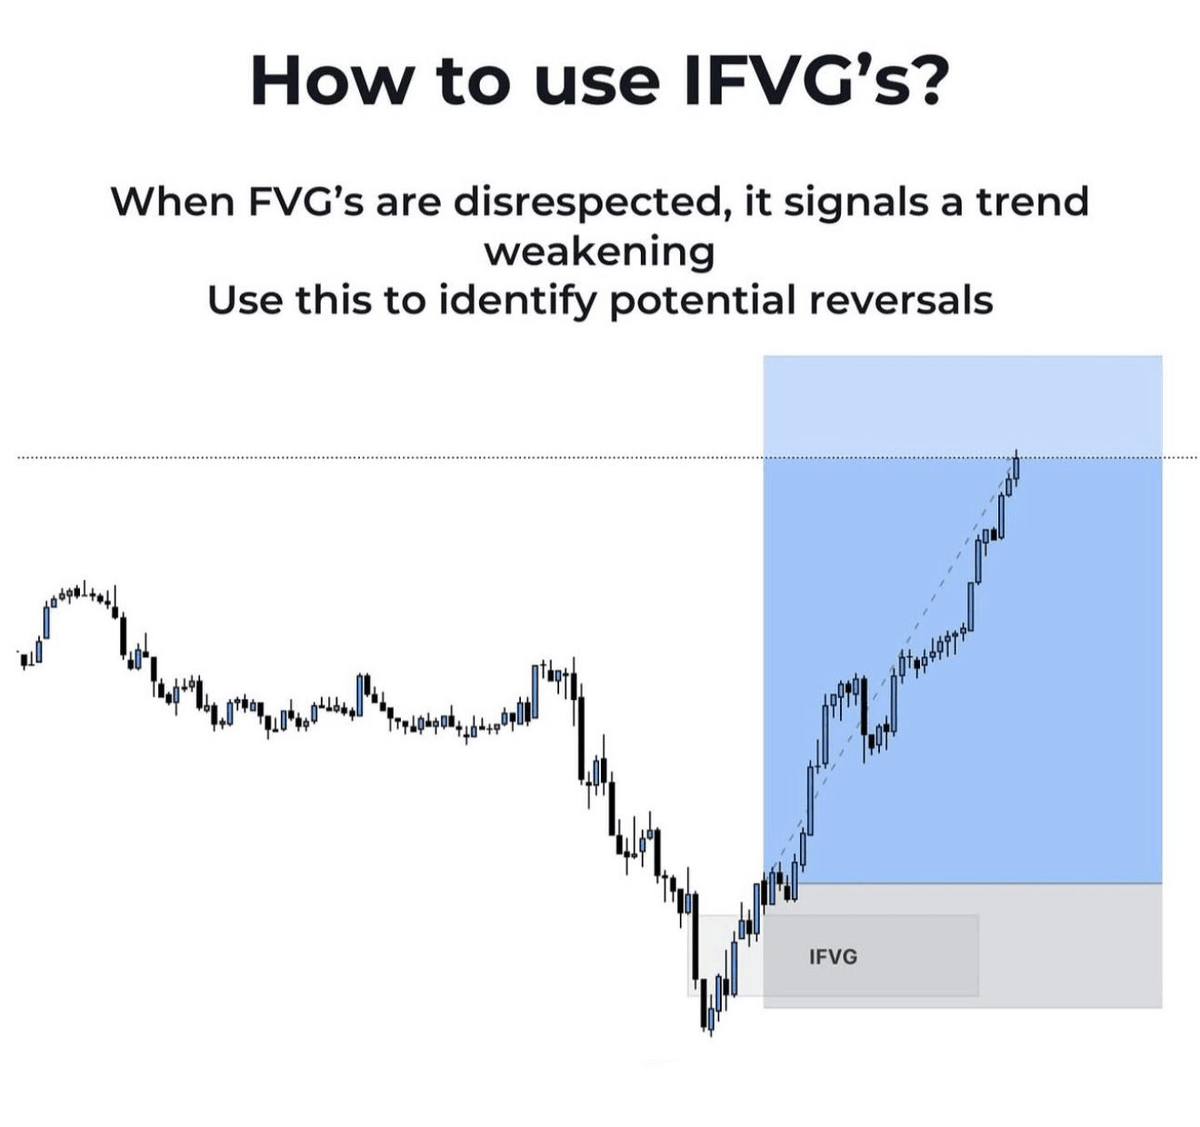
1.7 FVG Inversion Fair Value Gaps occur when a Fair Value Gap becomes invalidated. They reverse the role of the original Fair Value Gap, making a bullish zone bearish and vice versa.
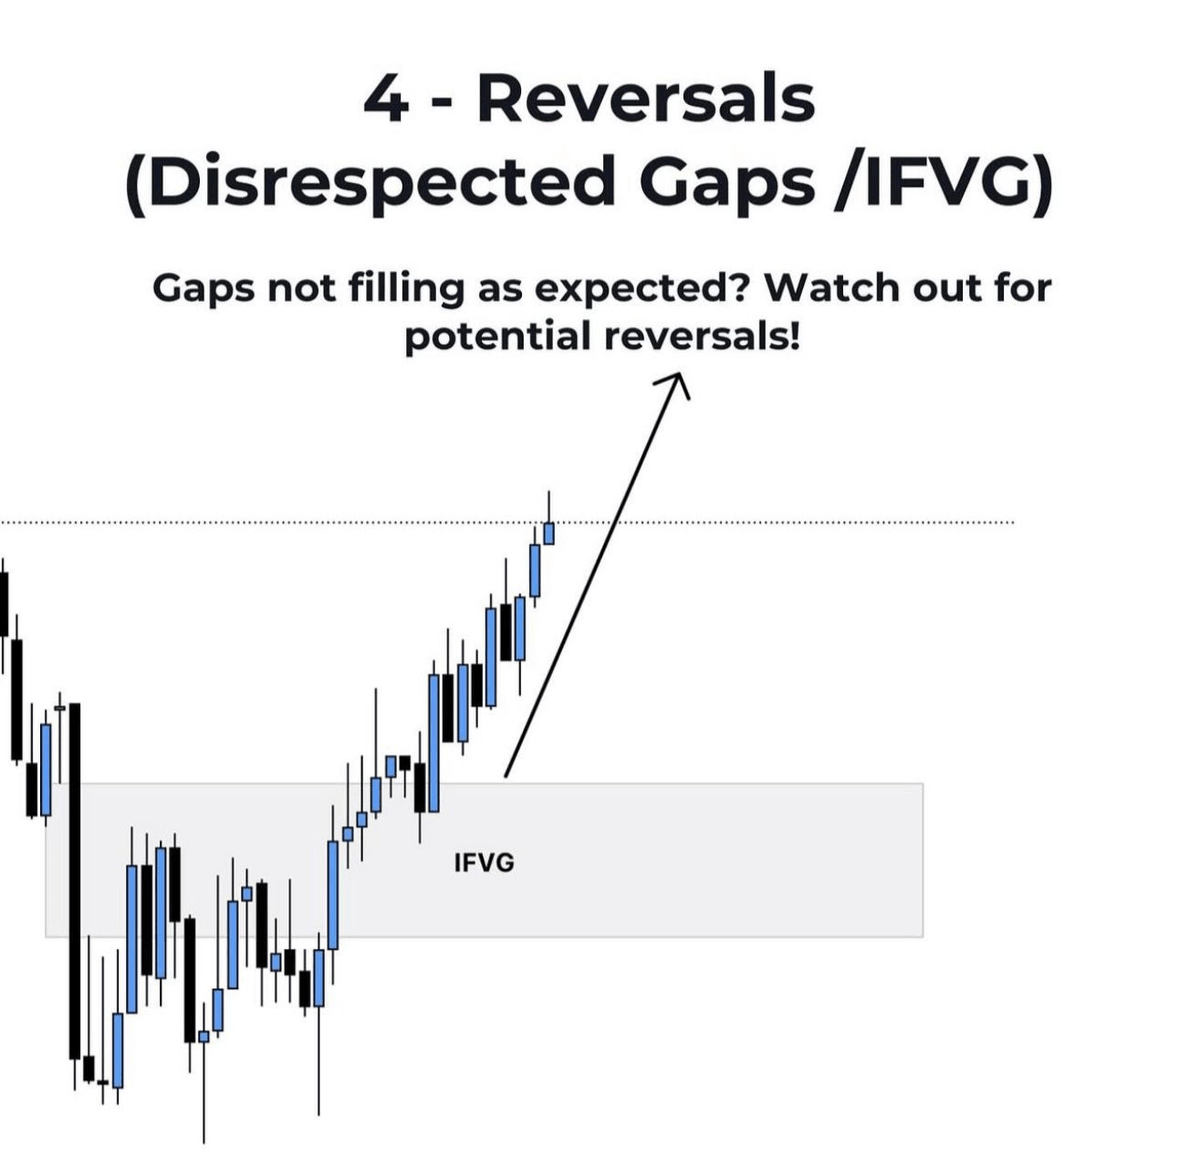
2. IFVG IFVG emerges when an existing FVG is invalidated. This invalidation shifts the role of the gap, turning a bullish FVG into a bearish IFVG, or vice versa.
2.1 IFVG Green zones highlight Fair Value Gaps (FVGs), imbalances created when price skips levels. Red zones show Inefficient Fair Value Gaps (IFVGs), smaller unfilled imbalances that often draw price back for quick fills and signal potential entry or exit points.
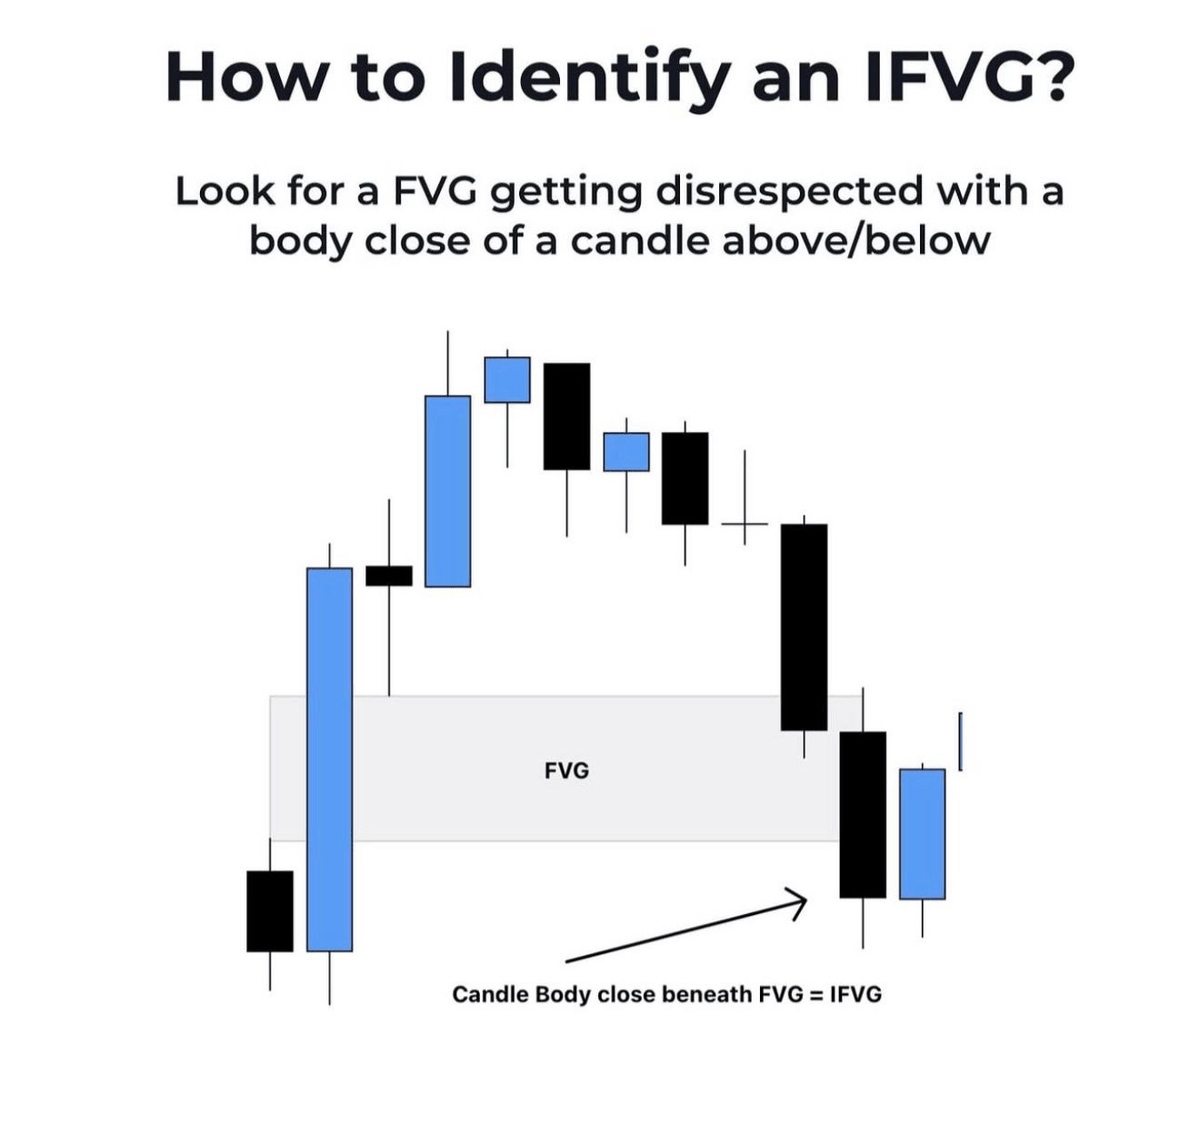

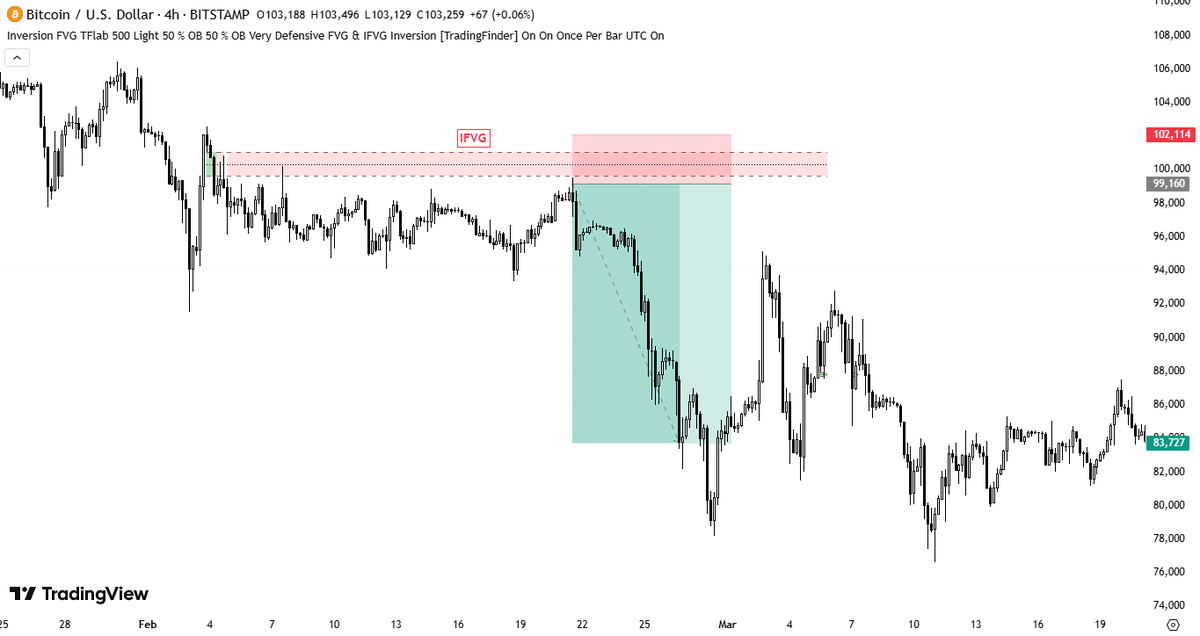
IFVG 2.2 An IFVG can be used as an indication of a price reversal, or as an area for taking trade entries or profits in an open trade.

IFVG 2.3 Traders often set a limit order at the IFVG boundary, anticipating a retracement and for the area to hold. A Stop Loss is typically placed just beyond the IFVG or a nearby swing high/low to manage risk.

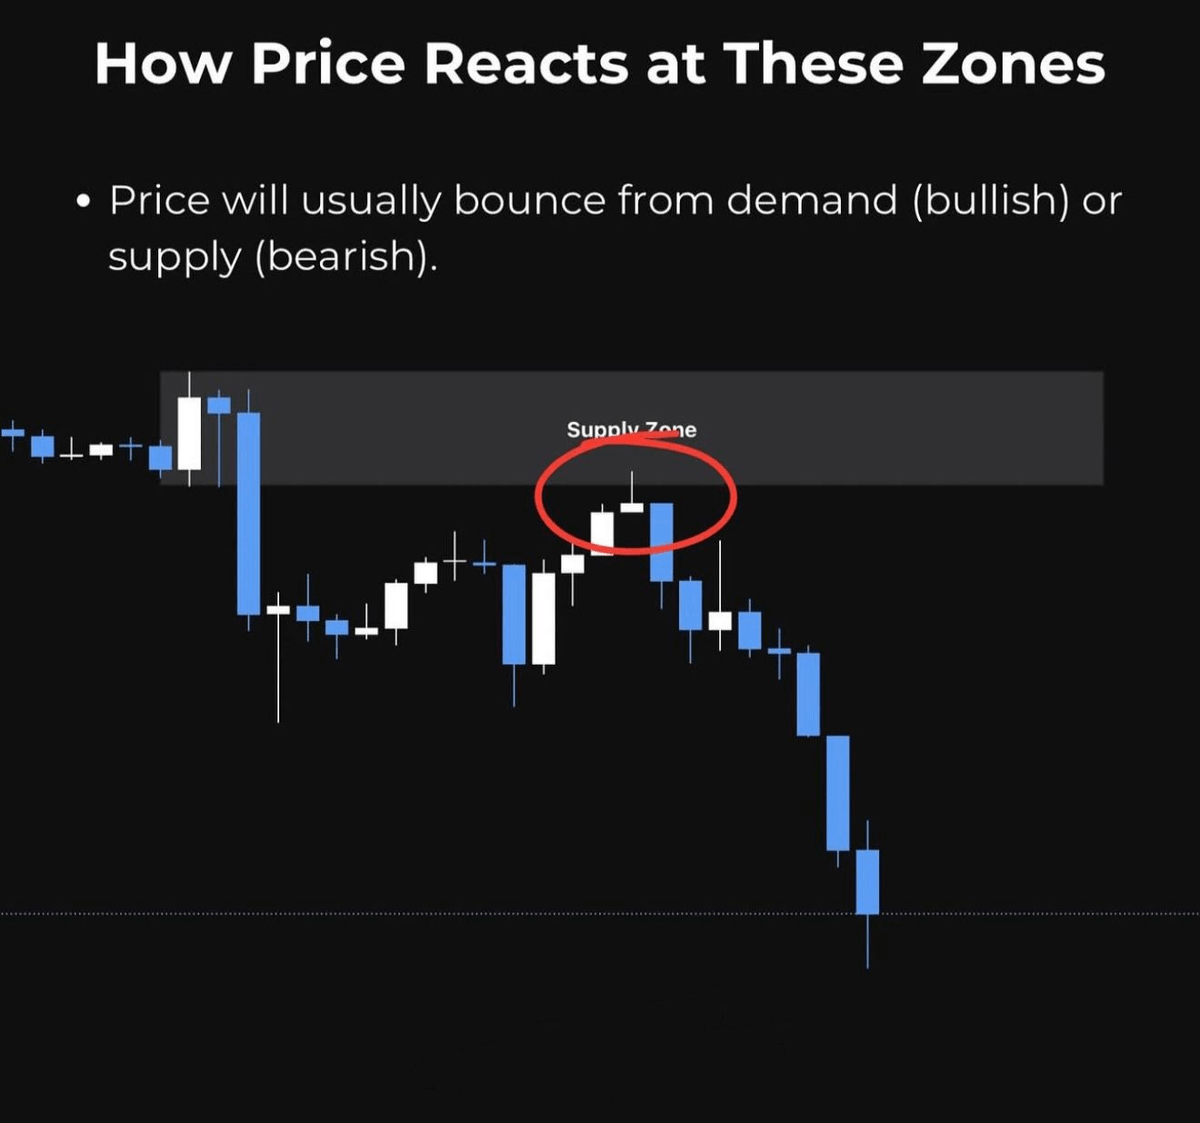
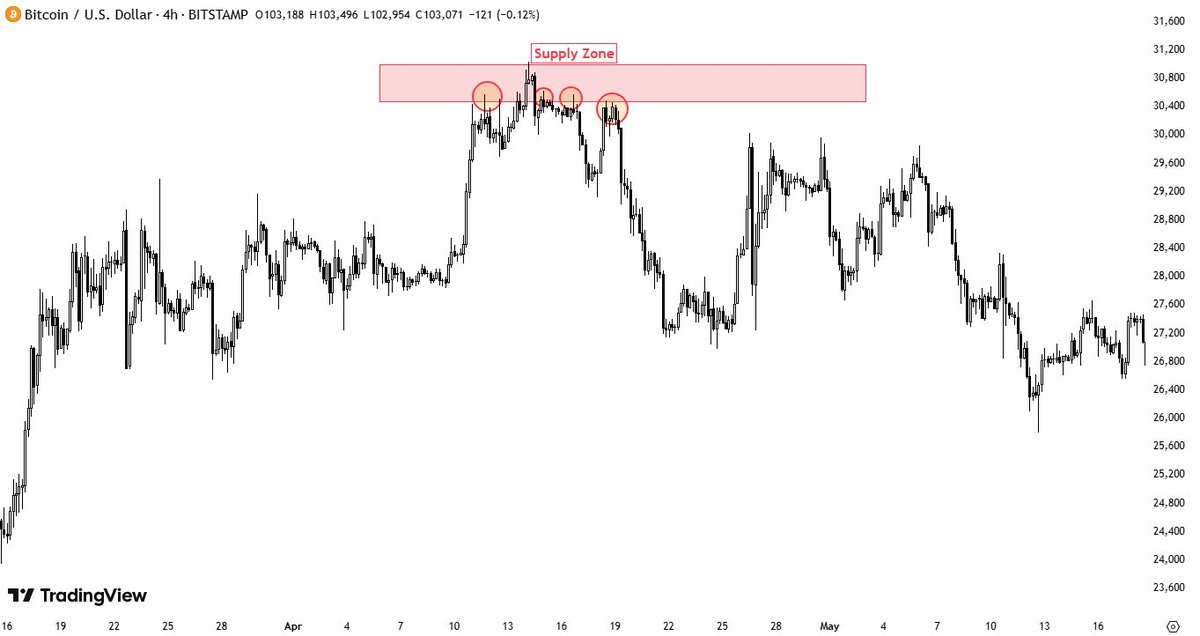
3. Supply and Demand Zone Demand zone: an area on the chart where demand strengthened, driving prices upward Supply zone: an area where selling interest was high, leading to a price decrease. This zones often lead to price reversals or trend continuations.
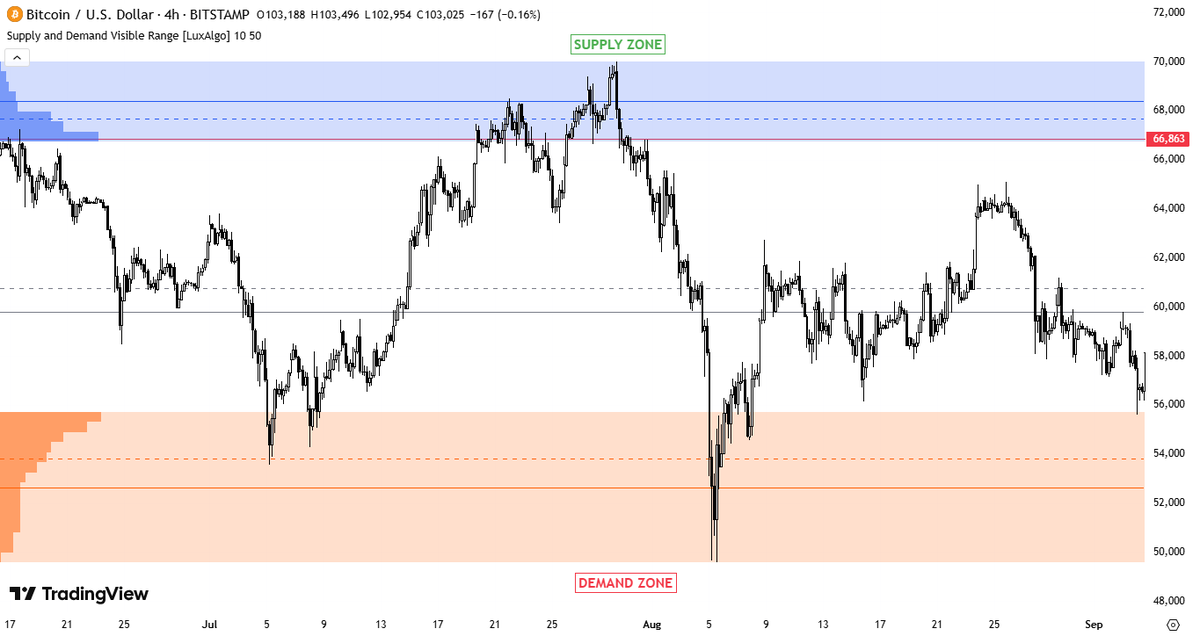
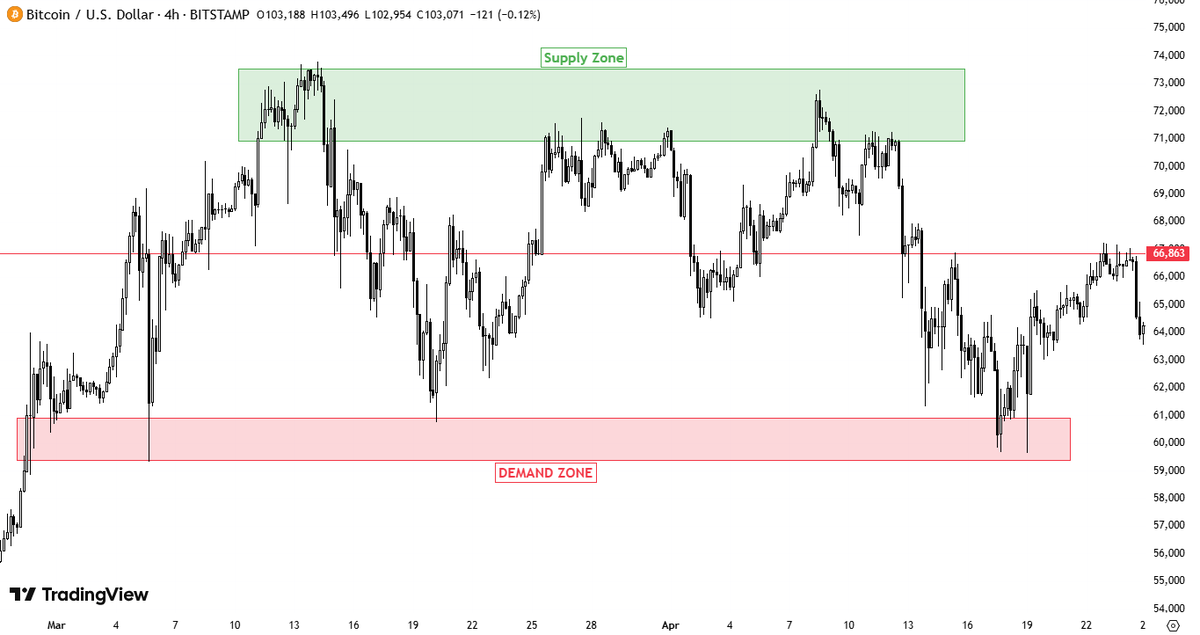
3.1 Supply and Demand Zone In a Higher Timeframe uptrend, price dips into demand zones make optimal buy entries. While in a Higher Timeframe downtrend, rallies into supply zones offer ideal sell (short) setups.

3.2 Supply and Demand Zone A Demand Zone is a range where a significant number of buy orders will likely be executed. If the price of the asset drops within that range.


3.3 Supply and Demand Zone A supply zone is often characterized by candle wicks rejecting higher prices. These wicks indicate that every time the price enters this zone, selling pressure overwhelms buying pressure and pushes the price back down.