
Just taking stock of things given the heightened worries about treasuries right now. 🚨🚨🚨 Starting with my scatter, I hold the view that we're shifting back to the right side (yellow dots), meaning overheating eco should see the curve bear flatten and recessionary path sees curve bull steepen but with little joy from the long end.

It's also worth noting in the above scatter that current levels are similar to 2007 and sorta-2001. Both pre-recession/bear market timeframes, with the path travelled similar as well (up and to the right followed by u-turn down). Meaning to say, the current bond market has continued to trade in a recessionary mindset.
It's jarring then, that the narrative around 30s trading at 5% has been distinctively bearish rates when the former position I laid out sounds distinctively bullish rates due to growth slowdown.
If we slice up the curve into its various curve dynamics we can see that the deepest expression of this recessionary mindset seems to be in the belly, with the 2s5s30s (bottom panel) at -81. Meaning 5s are quite rich to the rest of the curve. The 5s30s curve on a 20wk lookback shows it's been twisting steeper with 5s lower and 30s higher. Lastly, if we simply look at the individual tenors you can appreciate just how much the long end has risen relative to the front of the curve.
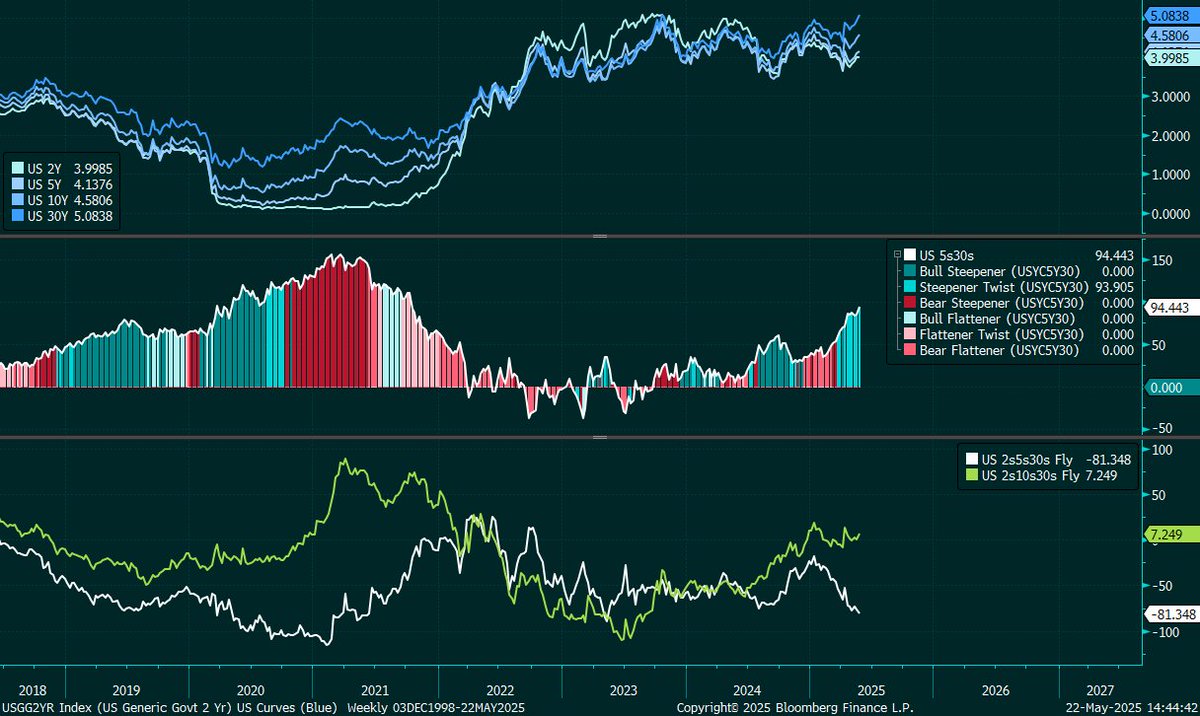
Obviously we can disentangle the risk of inflation and uncertainty in rates policy of the near term from the future, which many will refer to as term premium and as mentioned by many, TP can be mostly captured by the curve by the nature of how the models are constructed. Consider this premium as driven by inflation risk and volatility in the forward expected interest rates...
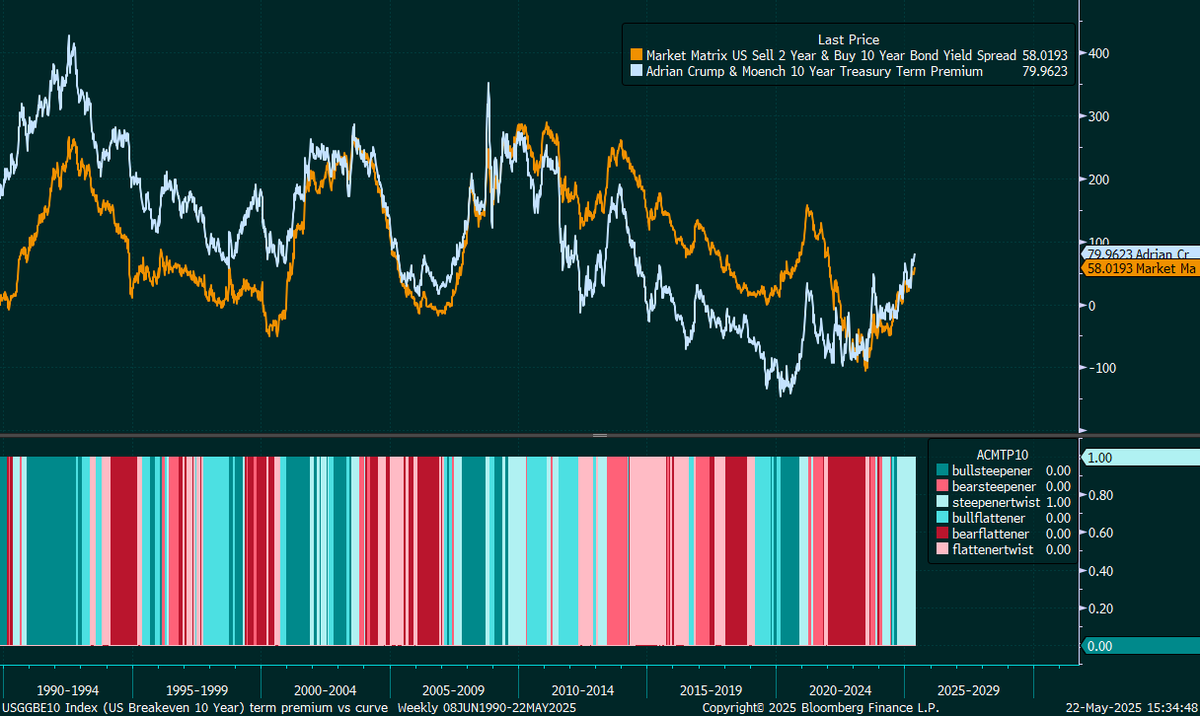
On the volatility side we can see that rate vol is currently pretty stable and not elevated as a whole. (I'm using SOFR swaps to replicate the MOVE Index here). Looking at the individual tenors' normalized vols in the bottom panel I also note that they are much closer currently than 2022-2023, where there was not only higher uncertainty in rates as a whole but across the tenors. Lastly, plotting ACM TP against the spread of 10 vs 2 N-vols does show some element of relatively increasing volatility in 10y partially driving things.

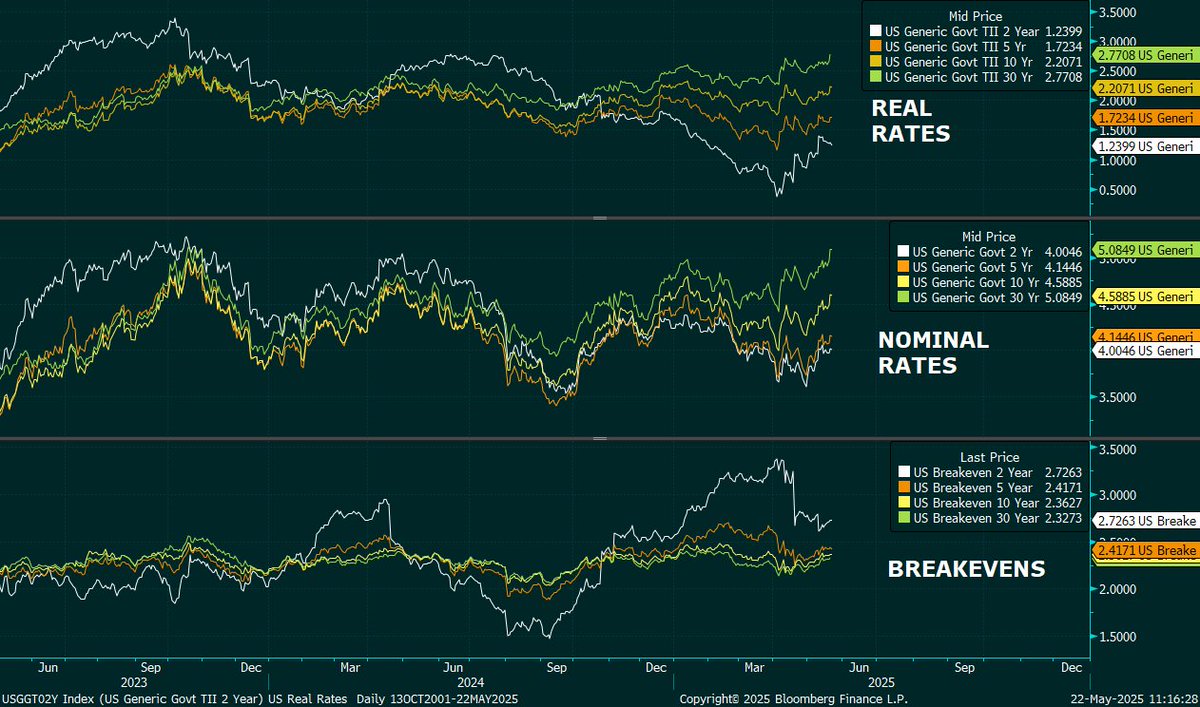
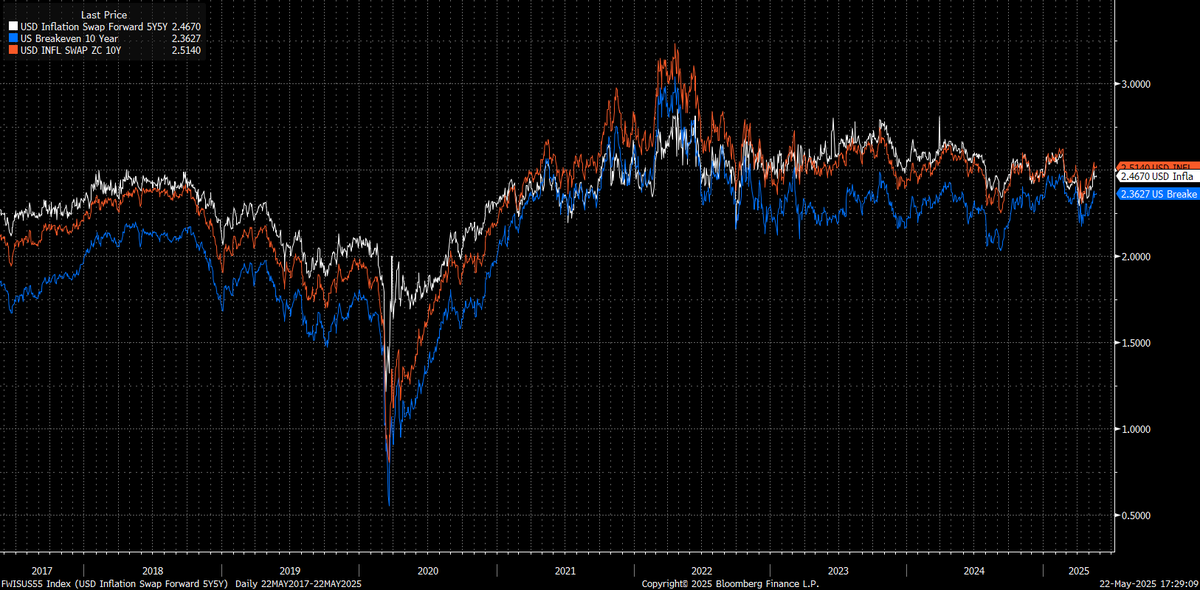
If we turn to the decomposition of nominal rates we'll also note that further out the curve, real rates are higher, as are nominals, while breakevens are largely stable. Even in terms of inflation expectations, however you measure it, 5y5y, 10y ZC Inflation Swap etc, they are stable. I.e. the curve steepness is not currently being driven by inflation expectations and a large part of the rise in the long end is driven by real rates.
If we look at long end nominal rates against the curve relative to where we are we can get a rough idea based on the last 30 year distribution what various moves entail. The blue distribution is the most recent 10 years. The main question for me amid this seeming cyclicality is whether we bear flatten or marginally bull steepen (where 30s dont move much). The most painful scenario is to keep bear steepening from here, which I believe is what cause that slight wobble in risk assets on Wednesday when 30s broke 5% to the upside convincingly.

To the main question, why are real rates rising especially on the long end? I believe that a lot of the forces that drove rates lower over the decades are unwinding. While we could argue that long term growth prospects are rising and driving real rates higher, i think it is more an issue of the bond market anticipating a reduced supply of capital in conjunction with an increased demand for capital. 1. If manufacturing shifts back to the US away from Asia, the shift from high savings economies (Asia) to US (low savings) can impact the supply of capital 2. Boomers that have been a huge source of capital are also now drawing down and investment horizons are likely to be shorter than 30years 3. The deficit and debt ceiling issues highlighted the structural concerns around long term US fiscal health
The last point on the deficit, in my mind is playing out on the curve in the following way: As the chances that the TCJA goes through increase, the rise in the deficit and potential inflation concerns combined with investor aversion to US$ assets will cause rising yields to constrain activity that results in economic weakness at the near term. This cycles back into the ongoing likelihood of rate cuts from the Fed while at the same time the market places a premium on owning long term US debt.
Can this all go away easily? Quite possibly but it also may not matter. While many are fearful of a wholesale buyer's strike in the long end I think that is mostly done. My base case is that as long as we see activity maintain, rates at the long end are likely rangebound and the action will centre around the front/belly where we see the curve twist/bull steepen as inflation comes closer to target and lets the Fed cut. In a slowdown, we see the curve aggressively bull steepen with little joy from the long end. If the economy overheats and we see inflation pick up then it's the bear steepener-into-flattener that kills everyone So I don't hate the long end, but I also don't really like it all that much either. ///////////////
