
(1/15) Why Price Bounces Where It Does- Welcome to the Fibonacci Zone! A Quick and very important 🧵 on Fibonacci- This thread is for every trader who’s tired of guessing levels. Bookmark it. Share it. Let’s get smart together. 🔁

2/ What is Fibonacci Retracement? It’s a popular tool used by traders to identify potential support and resistance levels using key ratios derived from the Fibonacci sequence. The most common levels: 🔹 23.6% 🔹 38.2% 🔹 50% (not a Fib number but widely used) 🔹 61.8% 🔹 78.6%
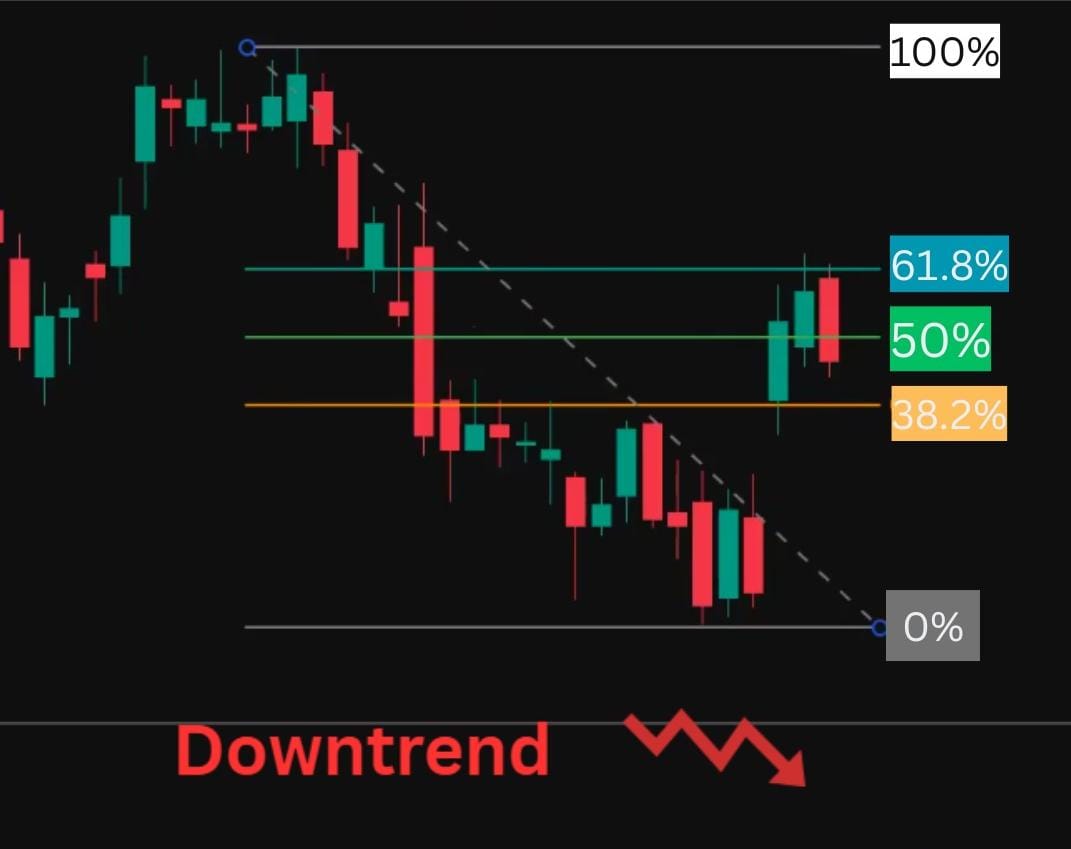
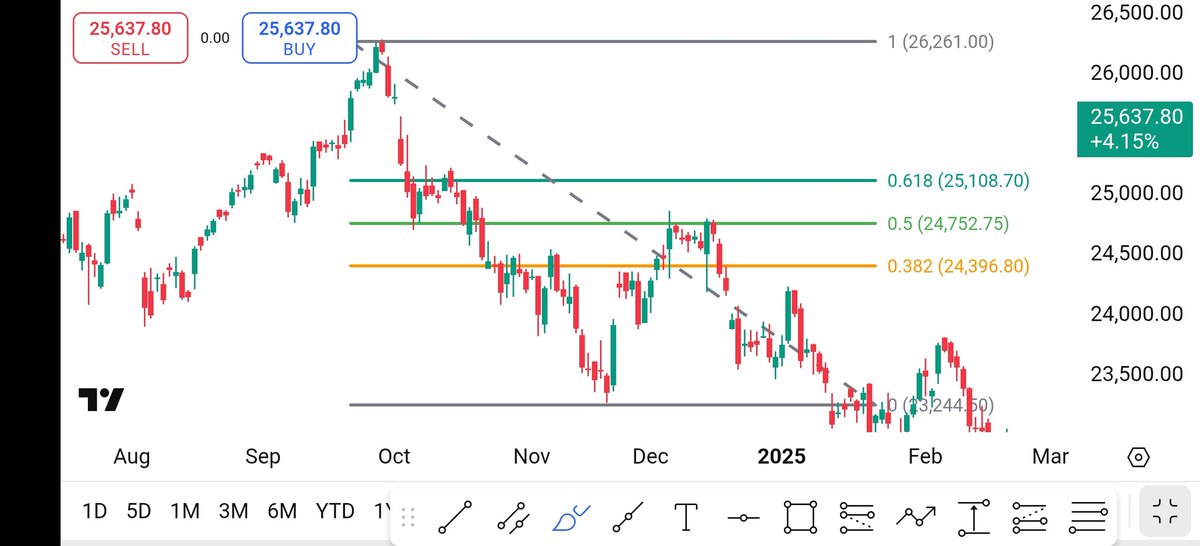
3/ These act like “zones” where the price may pause, reverse or bounce. How to use it? Identify a strong uptrend or downtrend Draw Fibonacci from swing low to swing high (for uptrend) or high to low (for downtrend) Watch how price reacts around the levels. Check examples -

4/ Want to learn Fibonacci retracement with real chart examples? I regularly share my market learnings, price action concepts, and trade setups on my Telegram channel - including videos on tools like Fibs. https://telegram.me/LearnBette...
5/ 📈 In an uptrend: You're looking for the price to pull back and take support near 38.2%, 50%, or 61.8% These are potential buy zones if the trend continues. 📉 In a downtrend: You look for resistance at these levels for possible short entries.

6/ When a stock or index retraces after a move, 50% and 61.8% are two of the most important levels to watch. 📌 50% isn’t technically a Fibonacci number, but it’s psychologically strong.. many traders expect half the move to be retraced. 📌 61.8% is the golden ratio.

7/ These levels often act as strong support/resistance and reversals from here can lead to powerful moves. Not magic. Just math + human behavior.
8/ Is That a Pullback or a Reversal? Fibonacci Has the Answer- What happens if it breaks below 61.8%? That’s usually your cue that the retracement is turning into a deeper correction or even a full trend reversal. 61.8% is the “last line of defense” for bulls in an uptrend.
9/ If price breaks and closes below it with volume or momentum.. it’s often not just a pullback anymore. What to watch for next: 78.6% becomes the next key level. 📉 If even that doesn't hold, chances are the previous trend is done, and you’re in a new trend altogether.
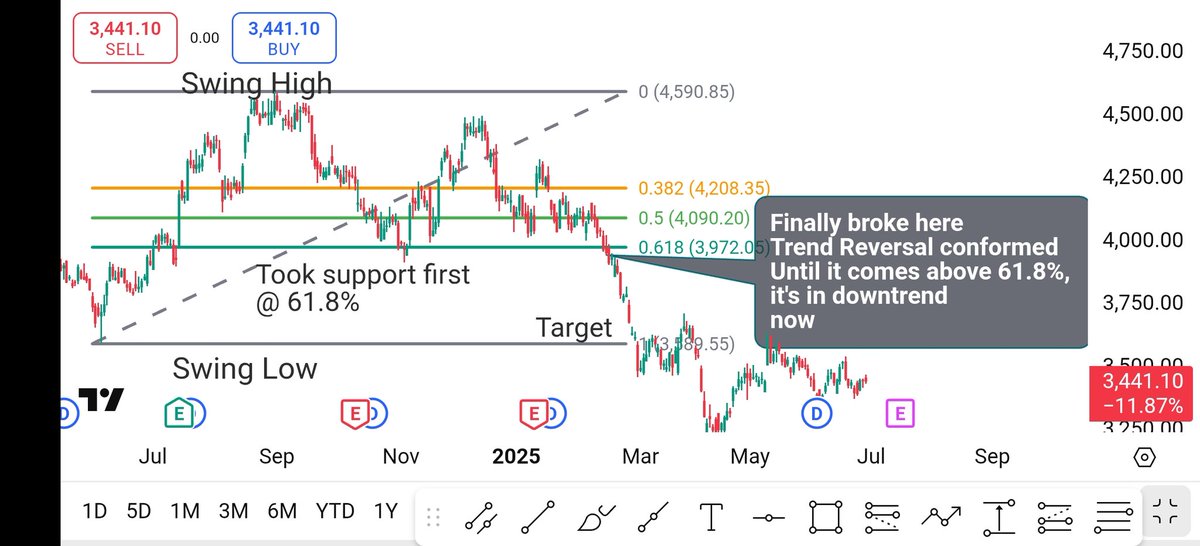
10/ In short: Below 61.8% = caution. The odds shift from "pullback" to "possible reversal." Time to zoom out and reassess. 📈 In a downtrend If price retraces up to 61.8% - that’s often the last strong resistance before sellers usually step back in.
11/ If price breaks above the 61.8%, it’s not a pullback anymore — the downtrend is likely weakening or reversing. Bulls taking control. Momentum shifting. Shorts getting squeezed.

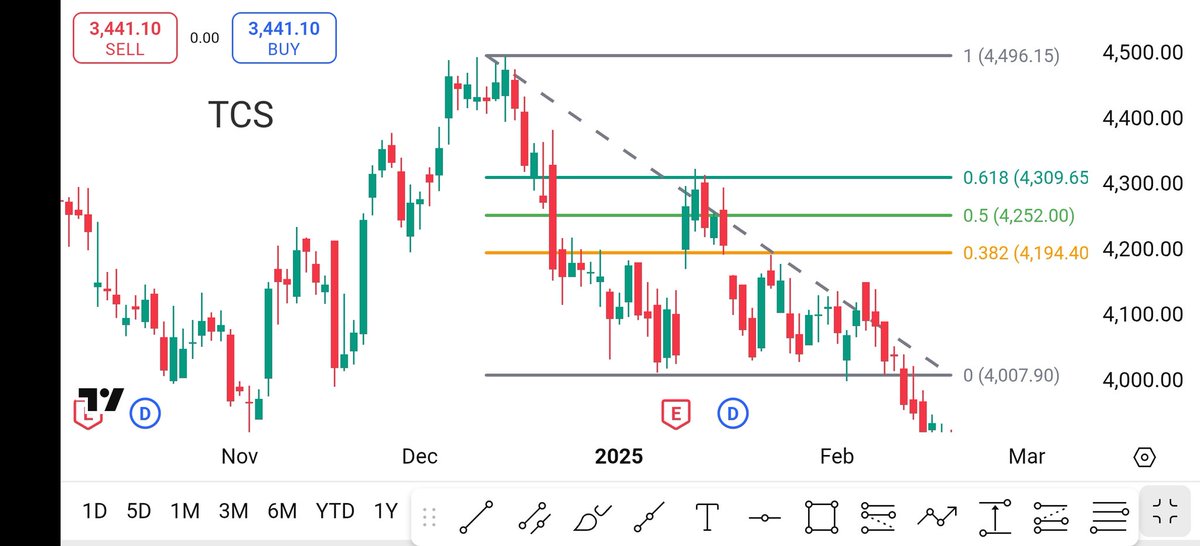
12/ 📌 Summary for downtrend: 50% & 61.8% retracement = key resistance zones Above 61.8%? Pullback might turn into reversal. Stay cautious on shorts if momentum shifts post-61.8%. Check example -
13/ Important Tips: 1. Combine with price action (candle patterns for entries and exits.) 2. Use along with volume or trend confirmation 3. Don’t blindly buy/sell on these levels – use them as areas of interest, not guaranteed zones.
14/ Quick Example: If a stock moves from ₹100 to ₹150 Then pulls back... 🔹 23.6% = ₹138.2 🔹 38.2% = ₹130.9 🔹 50% = ₹125 🔹 61.8% = ₹119.1 You’d watch these levels for support. Most important support zone - 119-125.
15/ Fibonacci retracement helps you plan better entries & exits by finding where price might react. Great for pullback entries Works in all timeframes Combine with price action Like and Repost and let me know if you want a thread on Fibonacci Extensions next! 👇