
The rich exit on signals. The poor exit on emotions. I’ve sold the top twice. I’ll do it again. Here are the top 3 signals I trust for predicting the top: 🧵👇

Before we start, repost and bookmark the first tweet so you don't forget to use it. In crypto, both permabears and permabulls lose money. One hopes for an up-only market, while the other screams of a crash only.
But how can you escape this and avoid becoming exit liquidity? Well, I’ve gathered the three best signals that have a 100% success rate in predicting the top. So let’s begin.
1. Pi Cycle Top Indicator The Pi Cycle Top Indicator has predicted major tops within a week of their occurrence. And you just need two things for it: • The 111-day moving average (111DMA) • A newly created multiple of the 350-day moving average (350DMA × 2)

For the past three market cycles, when the 111DMA moves up and crosses the 350DMA × 2, BTC has peaked. Since 2013, every 50% or more BTC crash has been predicted by this indicator. The 2013 double-top, 2017 top, 2019 local top, and even the 2021 top were all accurately
And what is this indicator signaling now? Right now, the 111DMA is sitting at $97.4K, while the 350DMA × 2 is at $172K. This is very similar to Q4 2020, which means the BTC top isn’t in yet.
2. Open Interest Dominance The first indicator was for predicting the BTC top. This one is for predicting the altcoin top. And it’s called "Dominance by Open Interest."

Look at Bitcoin Open Interest (OI) and Others (altcoins excluding ETH) Open Interest. Whenever Others’ Open Interest > Bitcoin’s Open Interest, alts have entered their euphoria phase. During this time, start exiting your positions aggressively, as alts will top within 1–2
On 1st March 2024, Others’ OI surpassed Bitcoin’s OI, and the Altcoin Market Cap peaked on 14th March. On 30th November 2024, Others’ OI surpassed Bitcoin’s OI, and the Altcoin Market Cap peaked on 4th December. Right now, Bitcoin OI is at $34.38B and Others’ OI is at $21.94B,
3. ETH Bands We’ve covered how to predict the BTC and altcoin tops. Now, here’s an indicator to spot the ETH top. And it’s based on global liquidity.
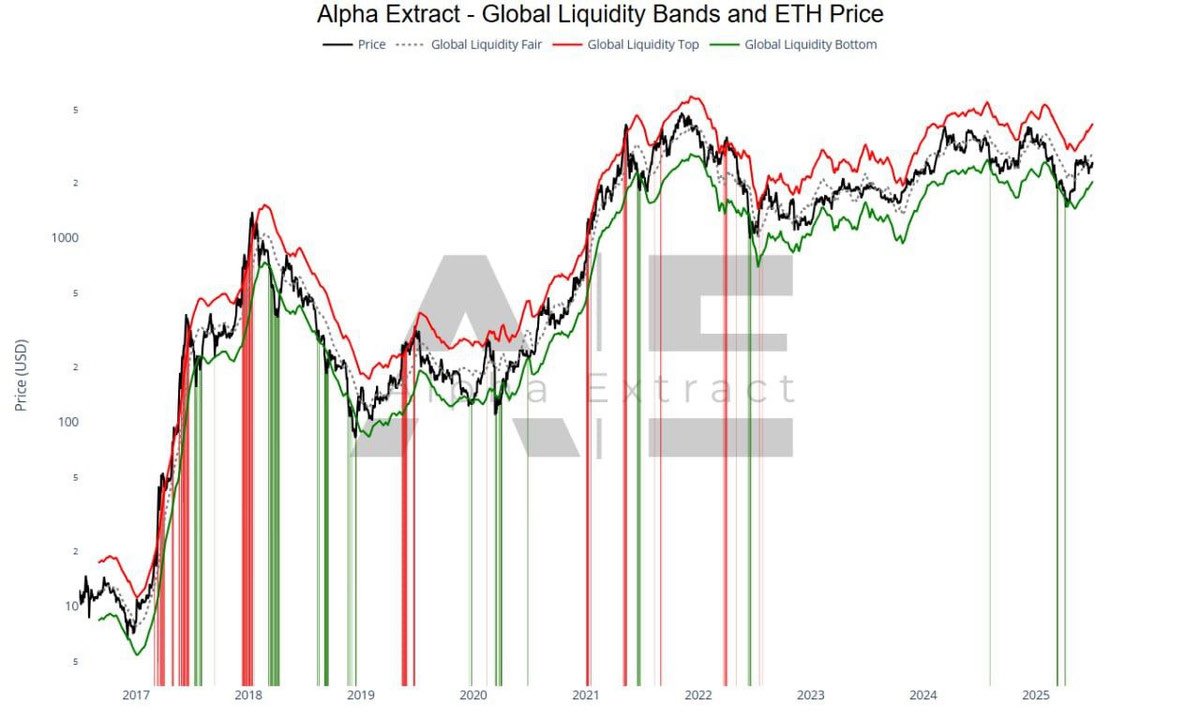
$ETH usually trades between the global liquidity top and bottom lines. When $ETH touches or goes above the global liquidity top line, it’s a sign to sell. Likewise, if $ETH touches or goes below the global liquidity bottom line, it’s time to “Buy, Buy, Buy.”
Right now, the global liquidity top line is at $4.1K, while the bottom line is at $2K. In April, ETH went below the global liquidity bottom, which marked the absolute bottom. Now, I’ll HODL my ETH until it touches the global liquidity top line. Once that happens, I’ll press
When will the top happen? Looking at the 4-year cycle, November/December 2025 is the timeline I’m projecting for a top. So far, I haven’t seen any signs that a supercycle will happen. I’ll keep monitoring my signals and expect them to trigger in Q4 2025.
Also, I’ll notify my audience so they don’t end up being forced bag holders. If you still haven’t followed me yet, do it now. And if you have any questions, drop them in the comments.