Wave Theory [Ichimoku Thread #15 🧵👇]

1 / 13 When people hear "Wave Theory" they normally think of Elliot Wave Theory which is very widely used. But very few people know that Ichimoku has its own Wave Theory, which in fact has some similarities to EWT but also its differences. ❓ What does Ichimoku's Wave
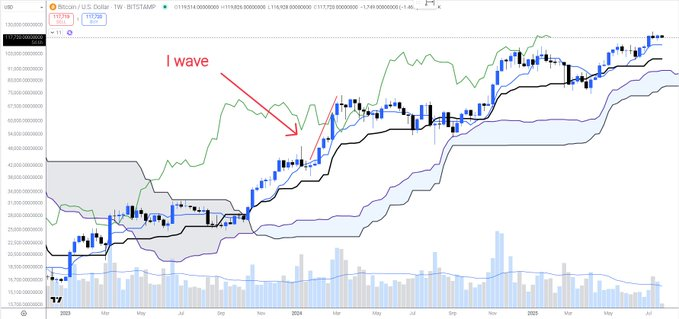
2 / 13 I wave I wave looks like the letter I:
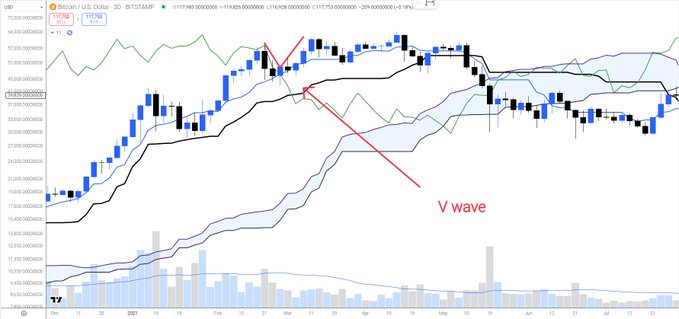
3 / 13 V wave V wave is a combination of two I waves:
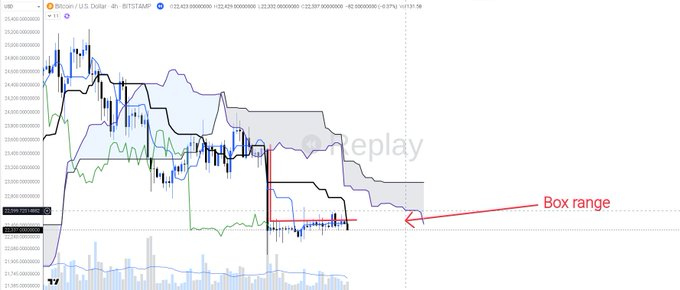
4 / 13 Box range Box range is a directional straight wave followed by a consolidation. As a bull/bear flag as in Classical Chart Patterns:
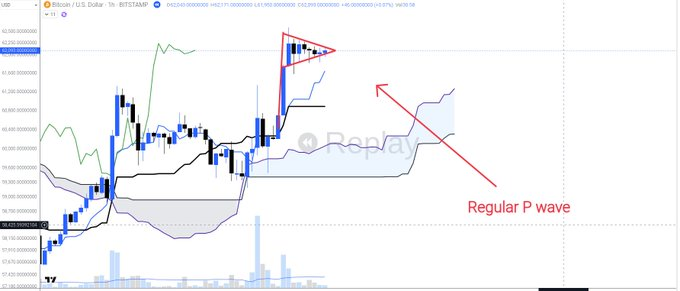
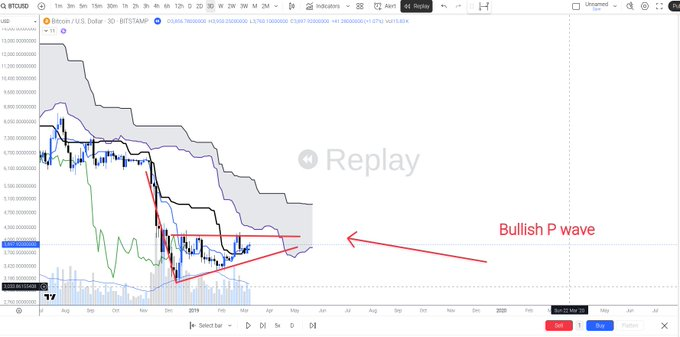
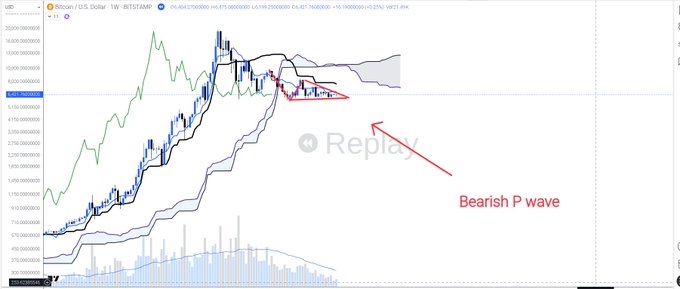
5 / 13 P wave (Also called Contracting Wave) P wave has three variations: 1⃣Regular P wave It has lower highs and higher lows, as a symmetrical triangle in Classical Chart Patterns. Regular P waves tend to break to the direction of the trend, or simply based on the
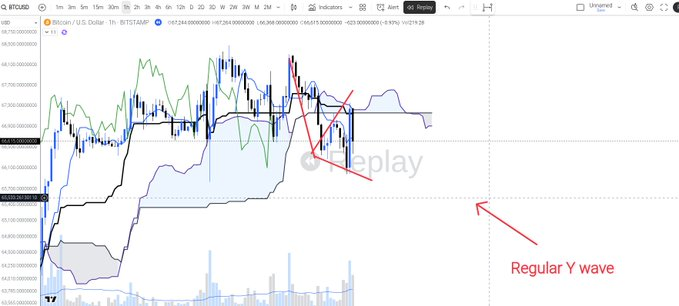
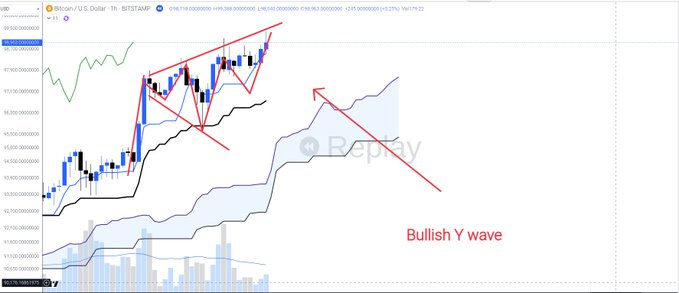
6 / 13 Y wave Y wave has also three subtypes: regular, bullish and bearish. The regular Y wave has the form of a megaphone. It has lower lows and and higher highs. Simply based on its type Y wave it's hard to forecast to which direction it will break. The Bullish Y wave
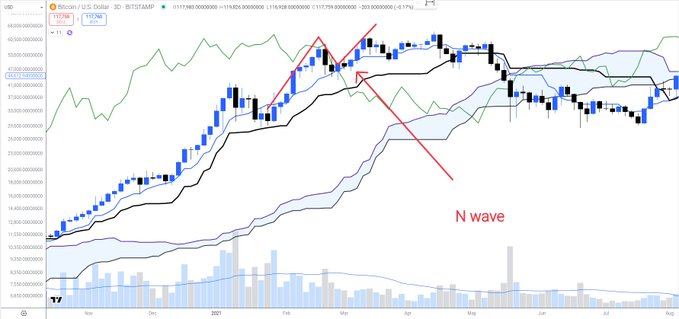
7 / 13 N wave N wave is the most important wave. It's the single building unit of the trend. N wave is a complex wave built by other waves. It could be I + I +I = I + V = N. Or, it could be some of the other wave types like P, Y, Box range, breaking out with an
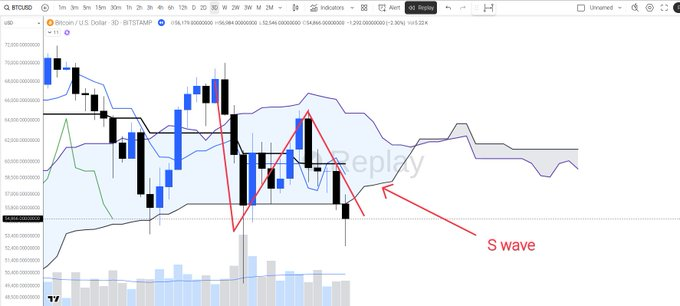
8 / 13 S wave The S wave has the shape of the letter S. It may turn into an N wave eventually, but what makes it different is that it has a higher low (for a supposed downtrend) and a lower high for an uptrend. If the low is taken and it becomes a lower low, this S wave
9 / 13 Sandan 📚Sandan is the basic structure of the trend as per Ichimoku's Wave Theory. One trend has one Sandan. 3⃣🌊 "San" means "three" in Japanese. One Sandan consists of three linked overlapping N waves. Technically, they look rather as two overlapping N waves

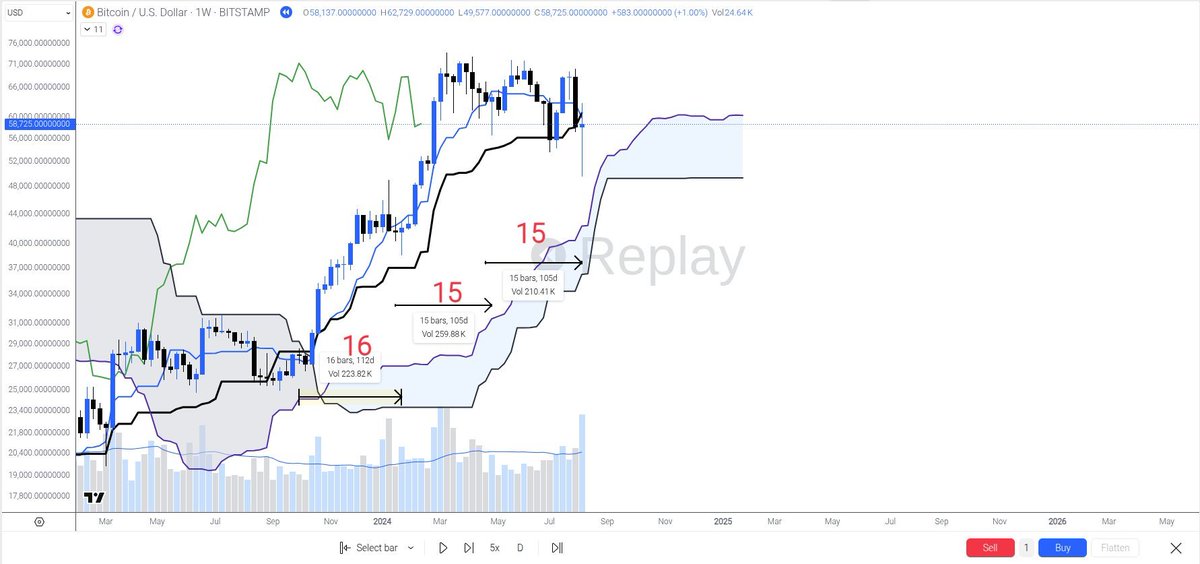
10 / 13 Here is a practical example of how to use the Wave Theory in a combination with the Time Theory. On the 9th of July 2024, at 53K, I posted a scenario which I subsequently posted that becomes my primary scenario, that $BTC should have one dead cat bounce on the
11 / 13 ❓How about the timing aspect of this forecast? 🫴 Well here we use the time cycles and see that the market has been manifesting 16 and 15 cycles for the last two weekly cycles. Which is a Kihon Suchi 17 or Taito Suchi 15-16. So, it makes sense the next low to
12 / 13 This Thread covered Ichimoku's Wave Theory. If you found it useful feel free to share it so the knowledge can reach more people.

9 / 9 Previous lessons 1. The Ichimoku TA system https://x.com/DoctorCatX/statu... 2. Tenkan Sen https://x.com/DoctorCatX/statu... 3. Kijun Sen https://x.com/DoctorCatX/statu... 4. Real and fake TK crosses https://x.com/DoctorCatX/statu... 5. SSA https://x.com/DoctorCatX/statu... 6. SSB https://x.com/DoctorCatX/statu... 7. Kumo
@DoctorCatX 💐💐💐
"ThEre WiLl nEvEr Be AnOtHeR AlT SzN bRo..." That has probably been the most repeated and feared phrase of this entire cycle. And as expected, it had become the loudest phrase at the most likely area for a HTF reversal. Which is exactly what we would expect from sentiment...
It's that time of the month again 🍿
This is how Elliott Waves views the situation. This update outlines how Elliott Waves expects the Bitcoin price to unfold. My own projections remain unchanged.

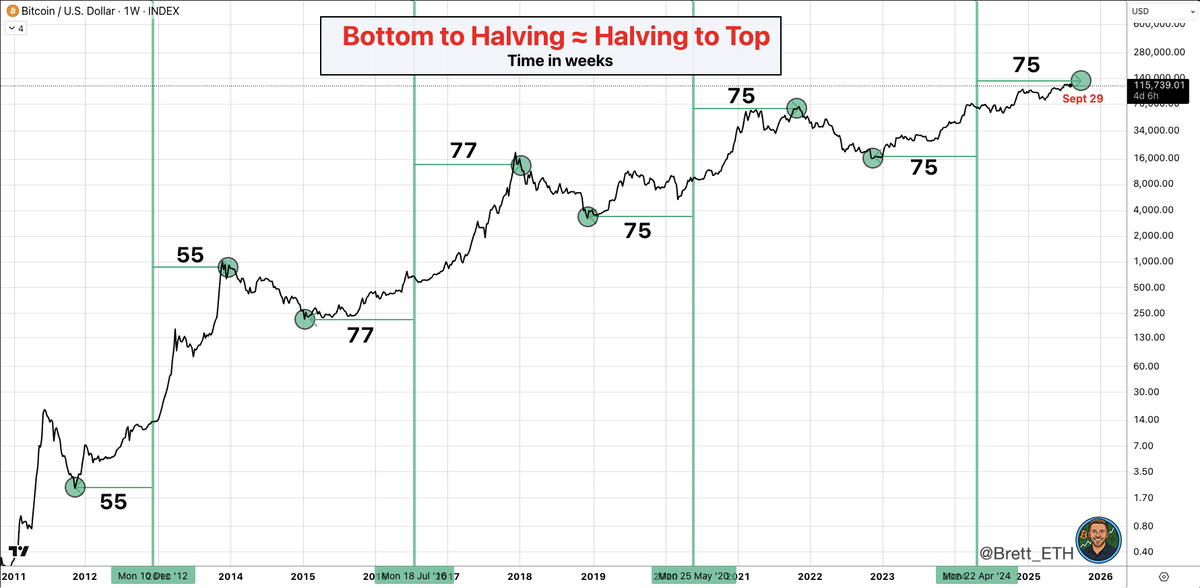
Bitcoin’s bottom-to-halving time ≈ halving-to-top time. The previous bottom was 75 weeks before the having. 75 weeks after the 2024 halving is September 29, 2025. The kicker? The halving-to-top is typically a few weeks shorter than the bottom to halving... This time will be