Price Theory [Ichimoku Thread #16 👇🧵]
1 / 9 📚Price Theory is the last one of the Three Ichimoku Theories. ⌛️Time Theory tells us when the market should reverse or accelerate. 🌊 Wave Theory tells us which should be the next price direction. 📈 Price Theory tells us where the price should go. Price Theory
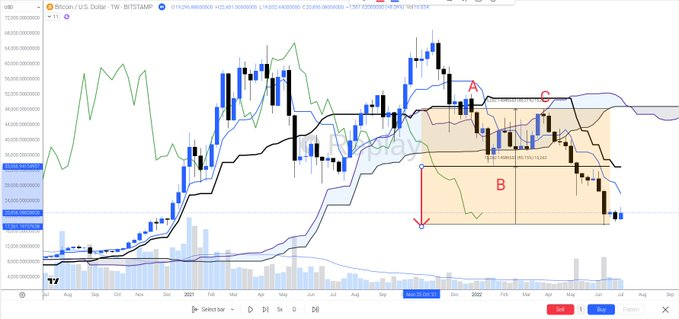
2 / 9 V model 📚V model is the most likely target when the last wave has made a relatively deep retrace. 🐂 The formula for bullish targets is: B + (B - C). See below an example: 🐻 The formula for bearish targets is: B - (C - B). See below an example:
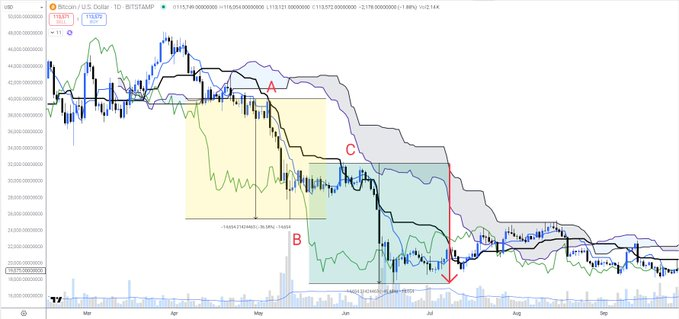
3 / 9 The rest of the models are more likely when the retrace of the last wave is rather shallow. All models can be considered always but higher likelihood is based on the retrace deepness factor. N model 🐂 The formula for bullish targets is: C + (B - A). See below an

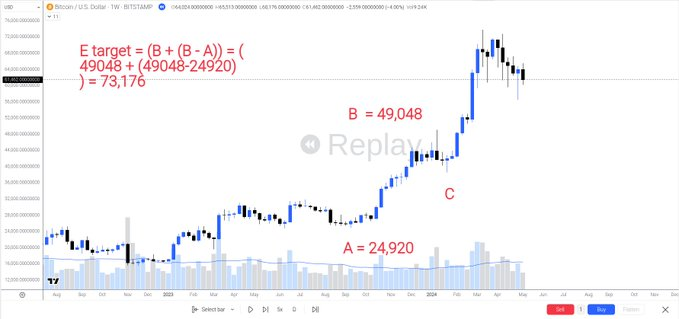
4 / 9 E model E model is the most extended target from the regular models. It often occurs when the previous wave has a minimal retracement (like a bull/bear flag). 🐂 The formula for bullish targets is: B + (B- A). See below an example: 🐻 The formula for bearish targets


5 / 9 NT model ⚠️NT model is a very specific in a sense, that sometimes its target is invalid. I.e., under certain conditions, the bullish target produced by it may be lower than the current price (and vice-versa for the bearish target). In this case, we simply ignore
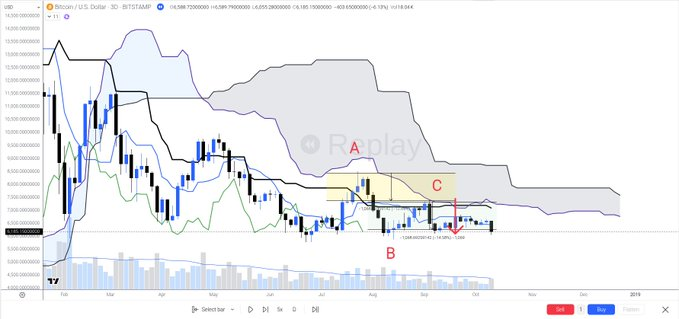
6 / 9 It's also important to note that the middle targets between the different models are also valid targets. For example, V target is 100 and N target is 200. Then 150 is also a target to look for. Or if N target is 200 and E target is 300, then 250 is also a target

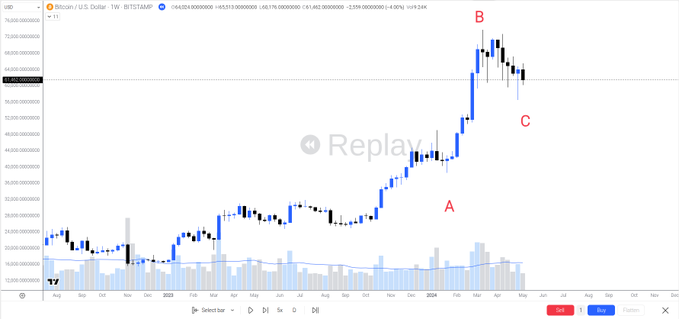
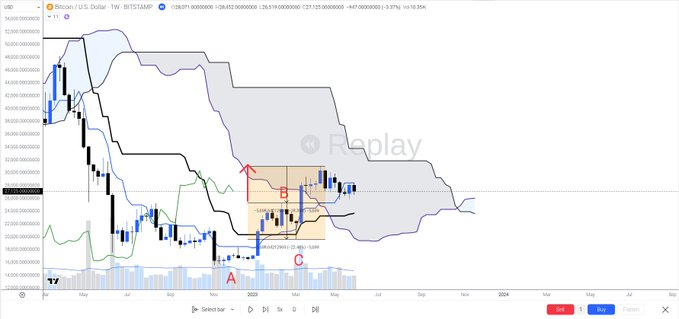
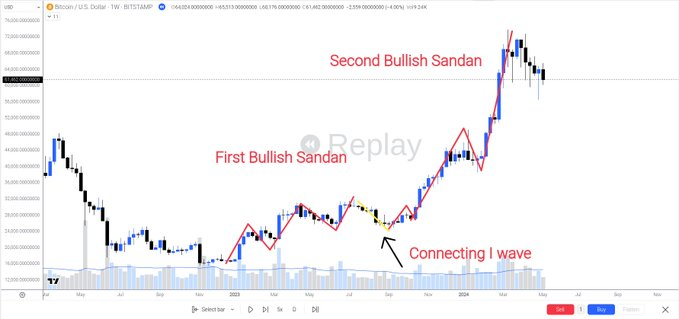
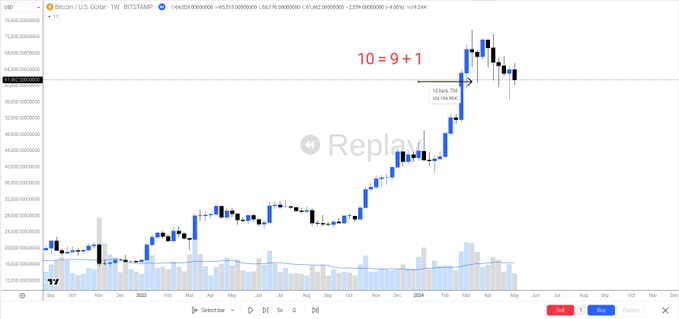
7 / 9 ❓How to apply the Three Theories together? In this example I will show a triple confluence which occurred in March 2024 hinting for end of a move based on the Wave, Time and Price theory combined together. First, based on the Wave Theory we observe that after one
8 / 9 This thread covered Ichimoku's Price Theory. If you find it useful feel free to share to original tweet so the knowledge can reach more people.

9 / 9 Previous lessons 1. The Ichimoku TA system https://x.com/DoctorCatX/statu... 2. Tenkan Sen https://x.com/DoctorCatX/statu... 3. Kijun Sen https://x.com/DoctorCatX/statu... 4. Real and fake TK crosses https://x.com/DoctorCatX/statu... 5. SSA https://x.com/DoctorCatX/statu... 6. SSB https://x.com/DoctorCatX/statu... 7. Kumo
#Bitcoin 500 day strategy is still on track. 1) Buy Bitcoins 500 days Before Halving 2) Hold & Do Nothing 3) Sell 500 Days After Halving 4) Repeat
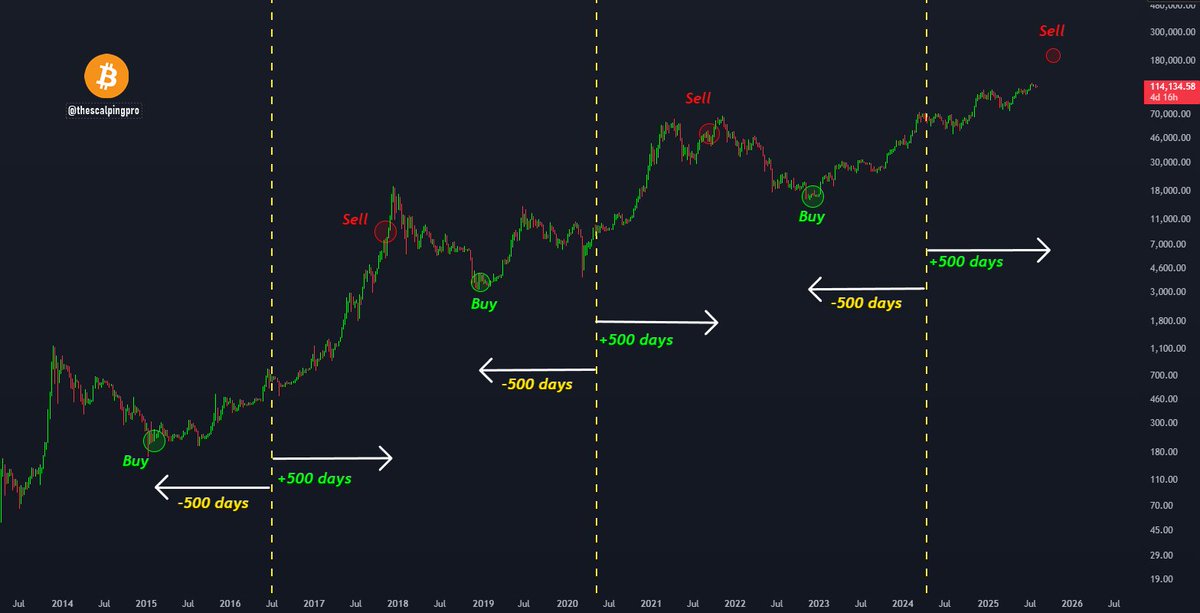
This is exactly what we want to see. As long as the altseason continues to get delayed and $BTC still outperforms, the longer this cycle will go on for.
$ETH you ready for this cup and handle action?

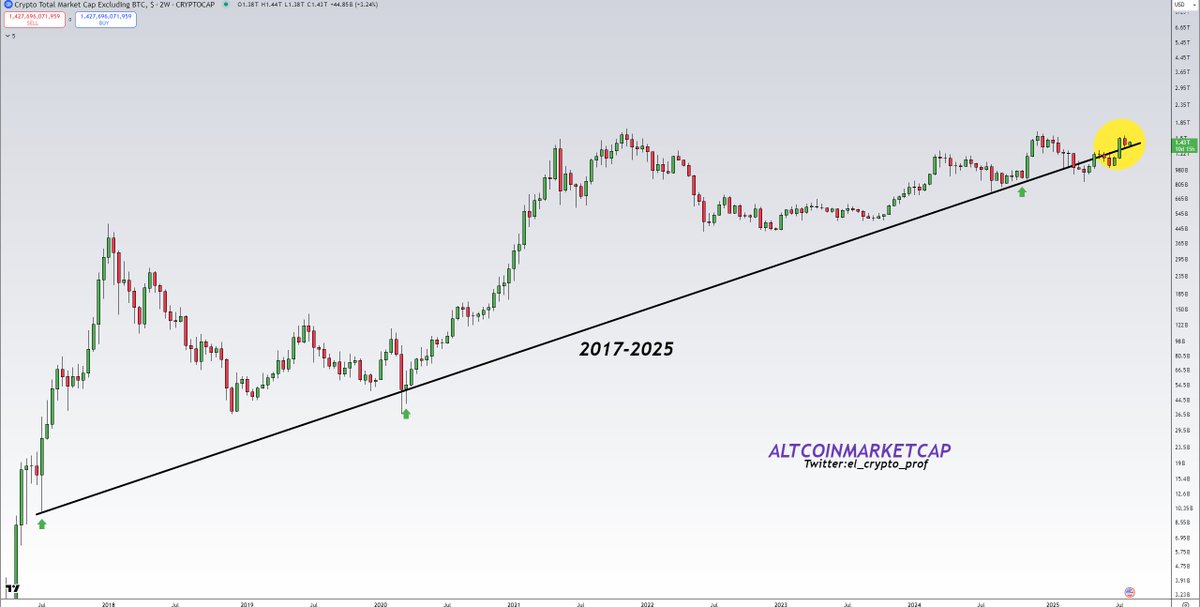
#Altcoins This is one of the most bullish charts for Altcoins out there. TOTAL2 has reclaimed a trendline that has been in place for +8 years. Higher timeframe is what matters.✍️ Higher.🫡