Precision Candles 🧵 PSP / PC / TPD
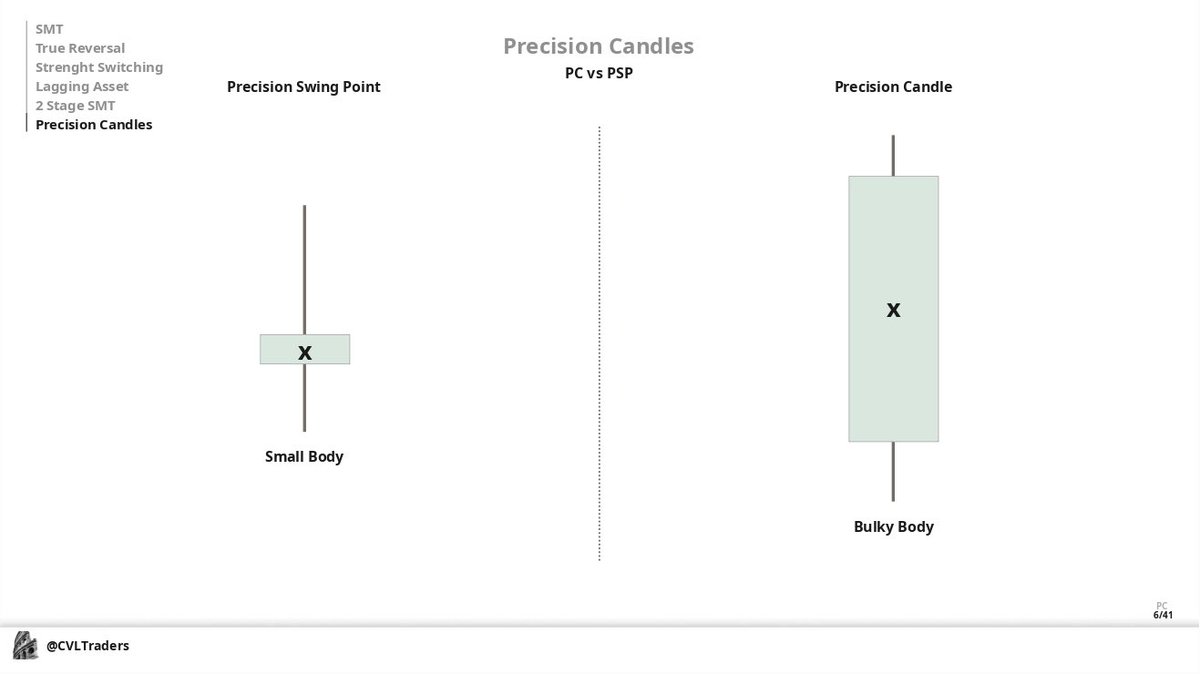
What is PSP? Precision Swing Point ( PSP ) is a Swing Point formation with a divergence between body closes on candle two that creates a swing

Confirmed PSP: That is complete formation of PSP, when we have candle 3 close.

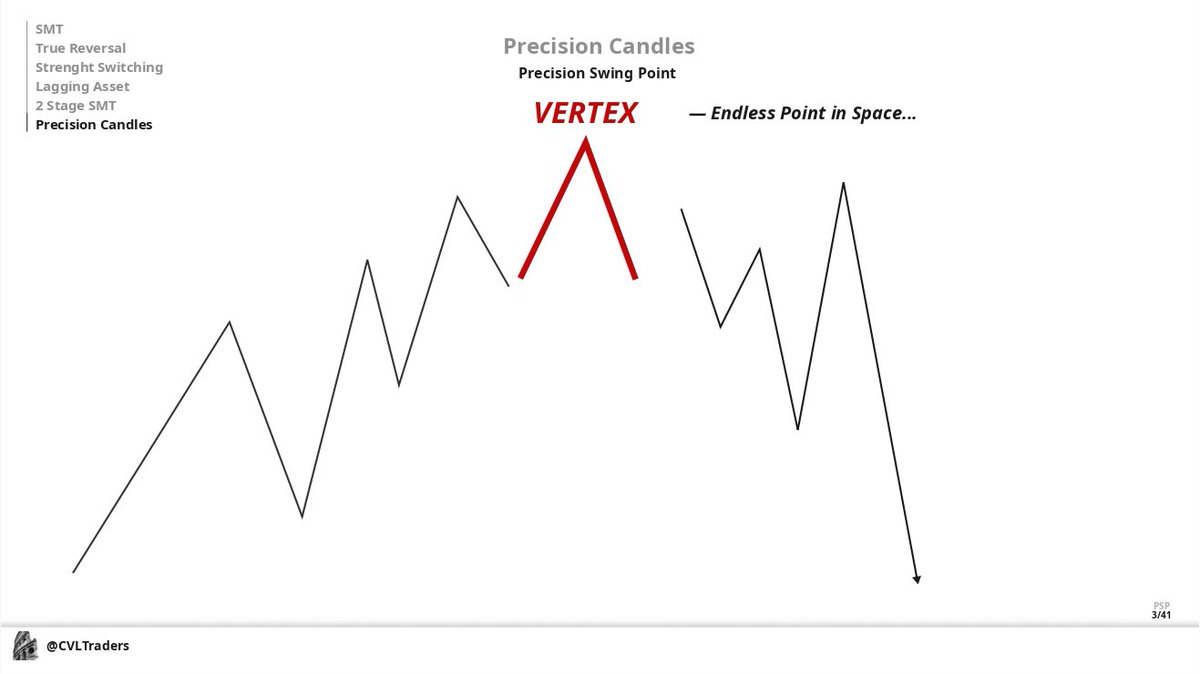
Precision Swing Point is Vertex, in other words you need to understand that this is the highest point of Reversal by Price
Precision Candles ( PC ) is when we have a divergence between candle bodies but don't create a swing point by candle 3, means the continuation on Triad that you're trading

That the the type of PC that’s creates a reversal signature and creates sSMT between Candle 2 and Candle 3

Precision Candle in continuation state in many times have bulky body, so that's not reversal signature and it's likely to continue the market direction
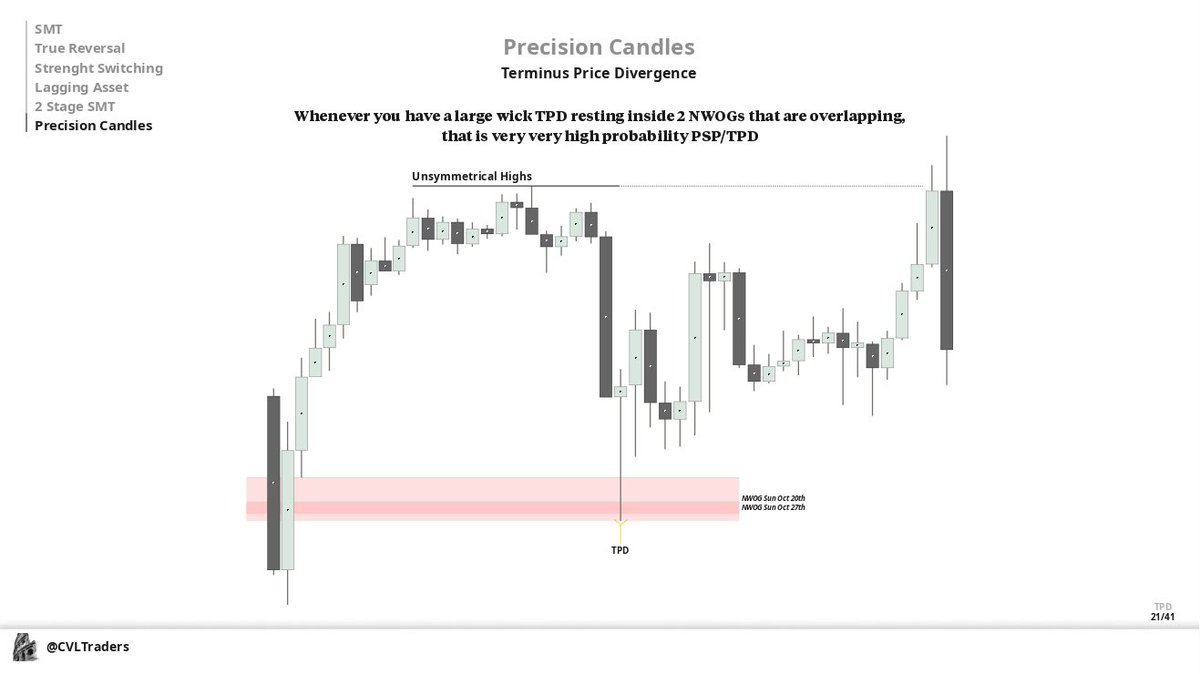
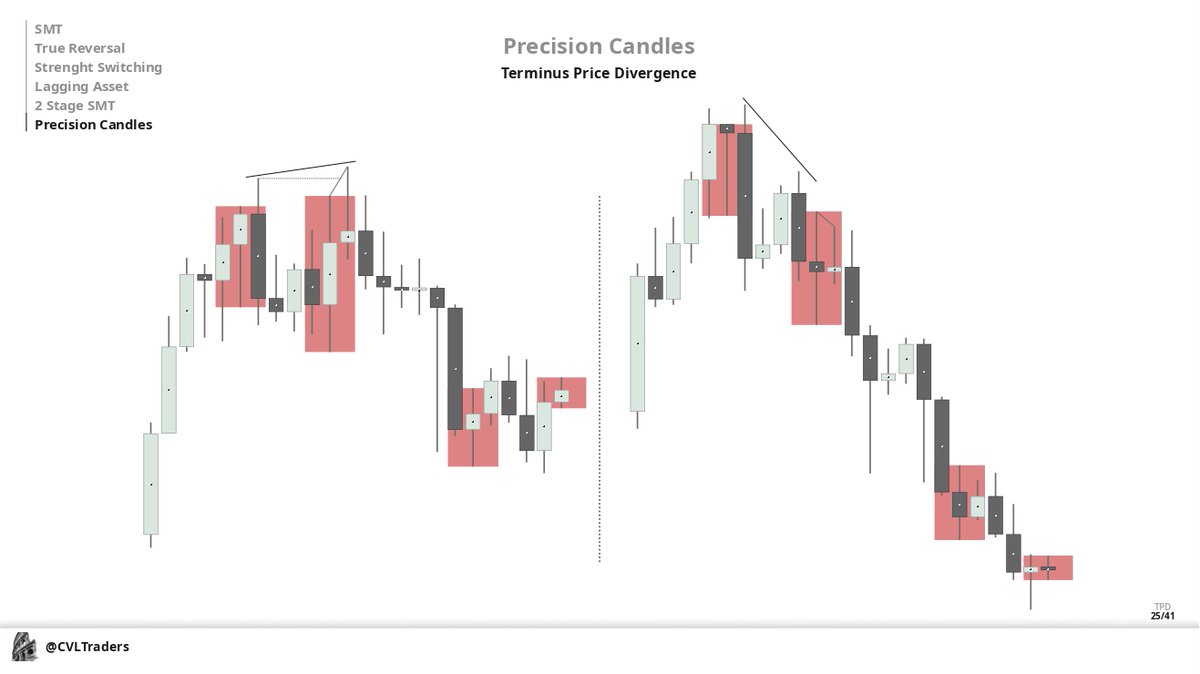
Terminus Price Divergence ( TPD ) is a 3 candle sequence means that every candle has it’s own function and meaning and this is divergence between C1 close and C3 Open
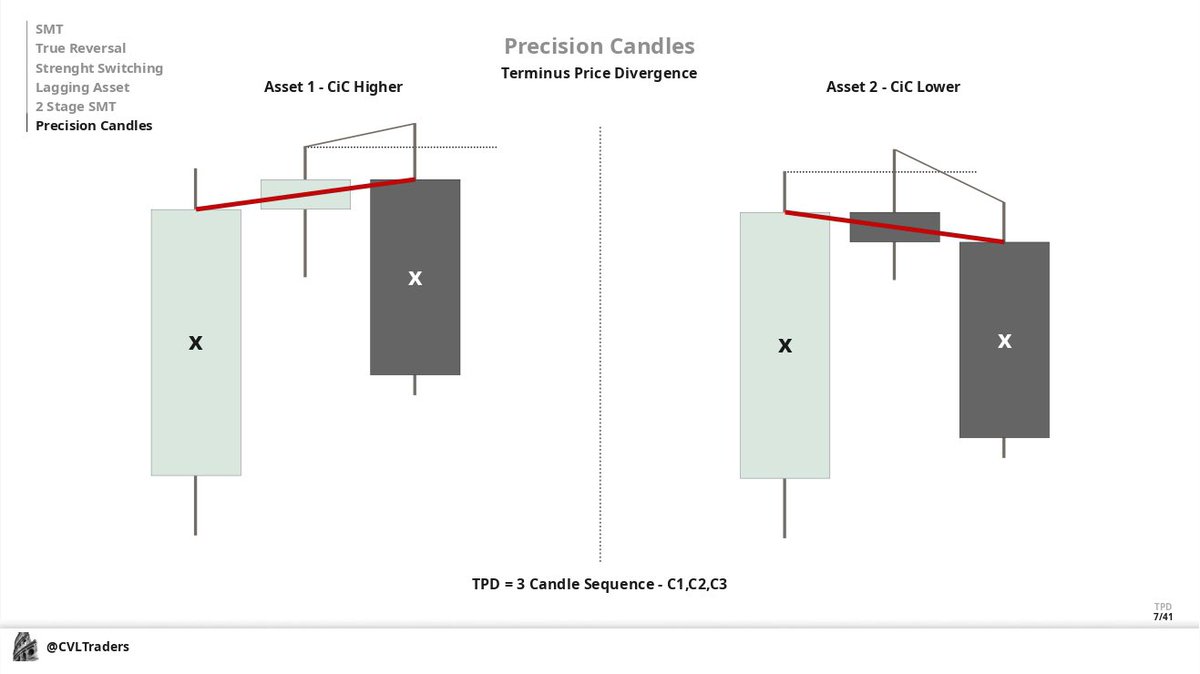
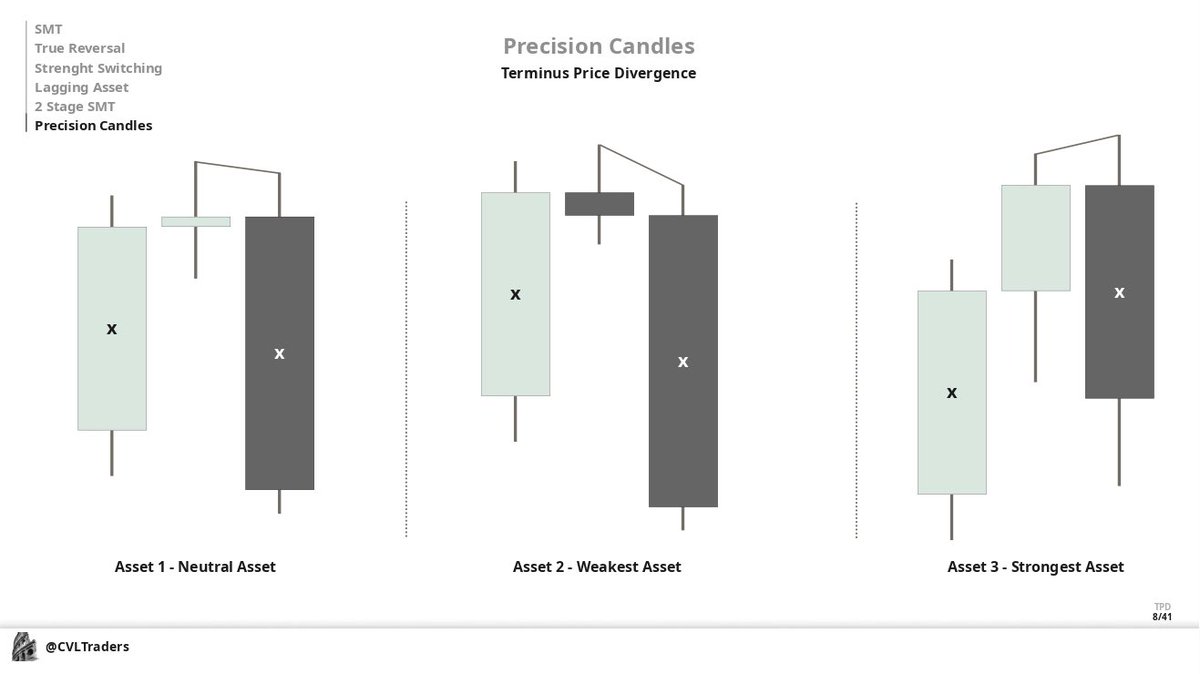
We measuring Strength & Weakness while using TPD within Triad that you're trading and the key here is to understand which asset is the leader, which asset is neutral and which asset is weakest
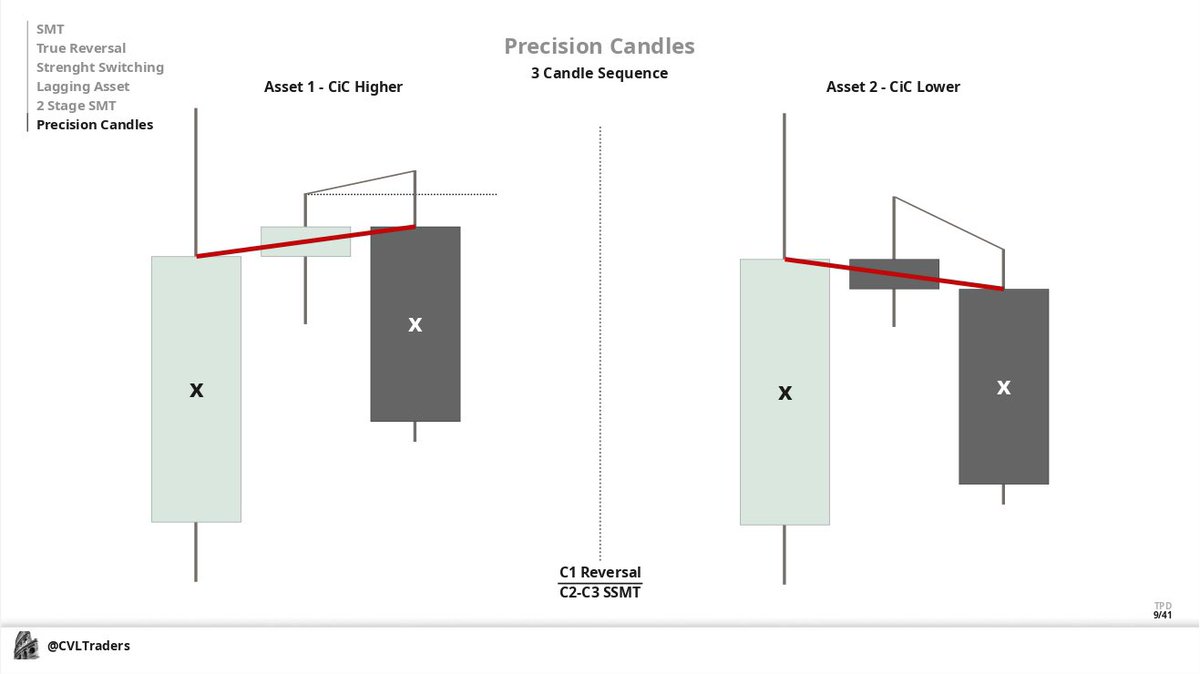
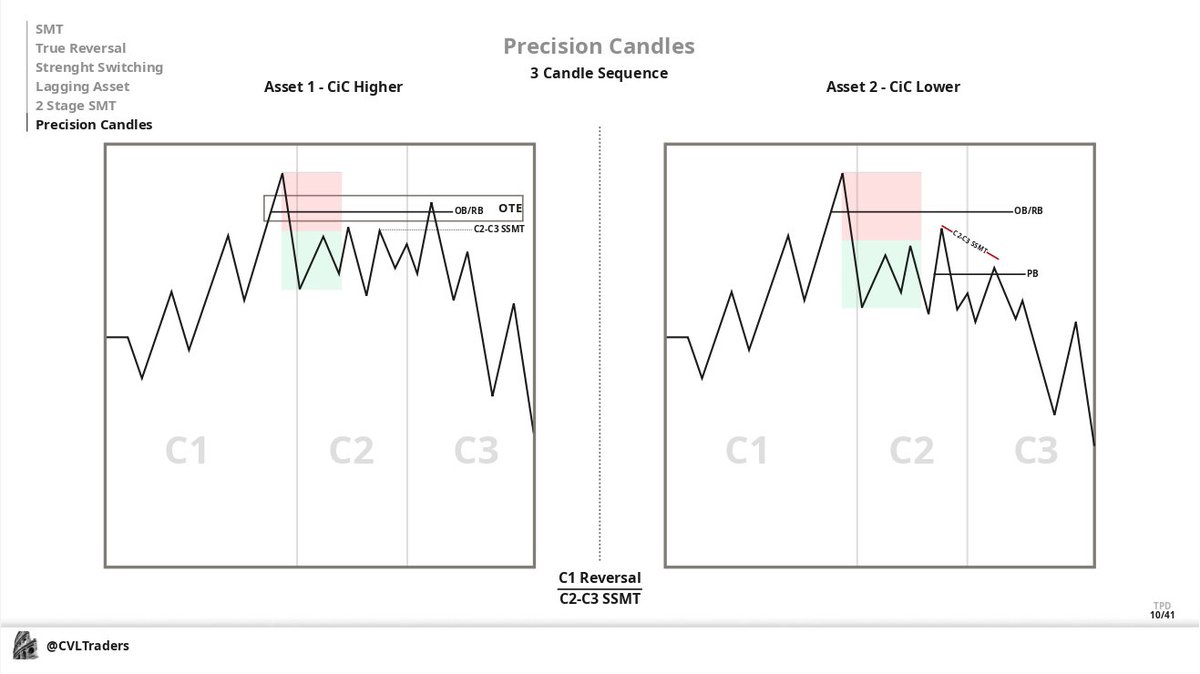
Here's some sort of TPD Profiles: C1 Reversal: C2-C3 sSMT
LTF Example of C1 Reversal: C2-C3 sSMT
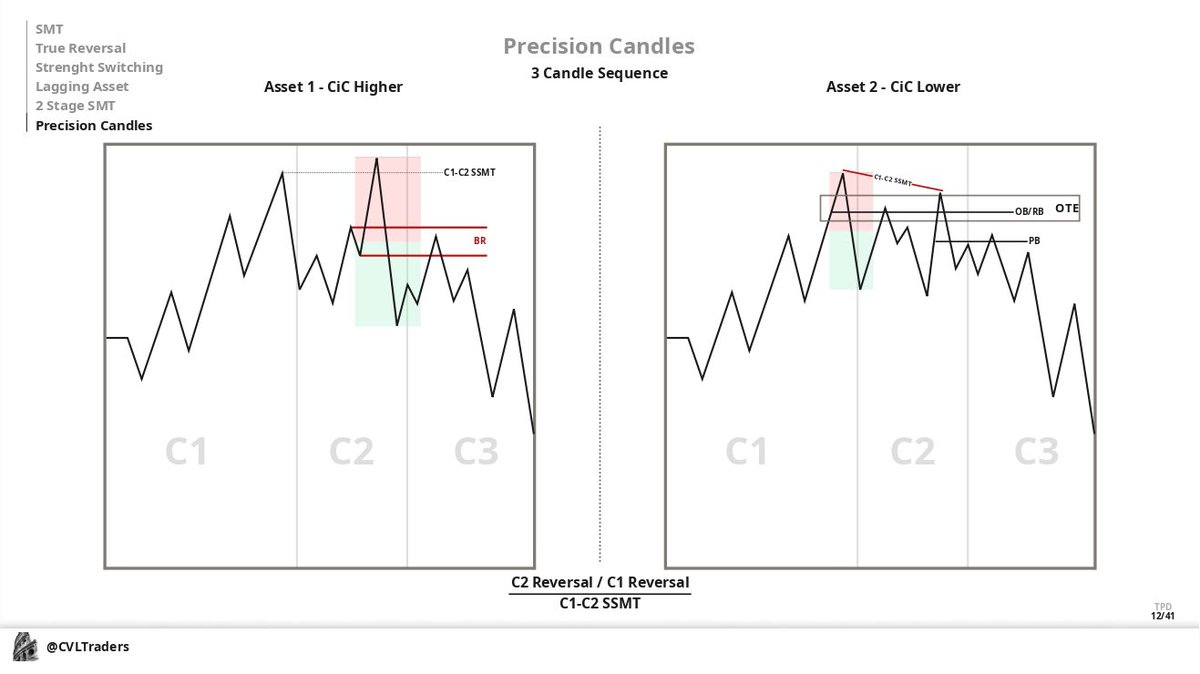
C2 Reversal / C1 Reversal: C1-C2 sSMT
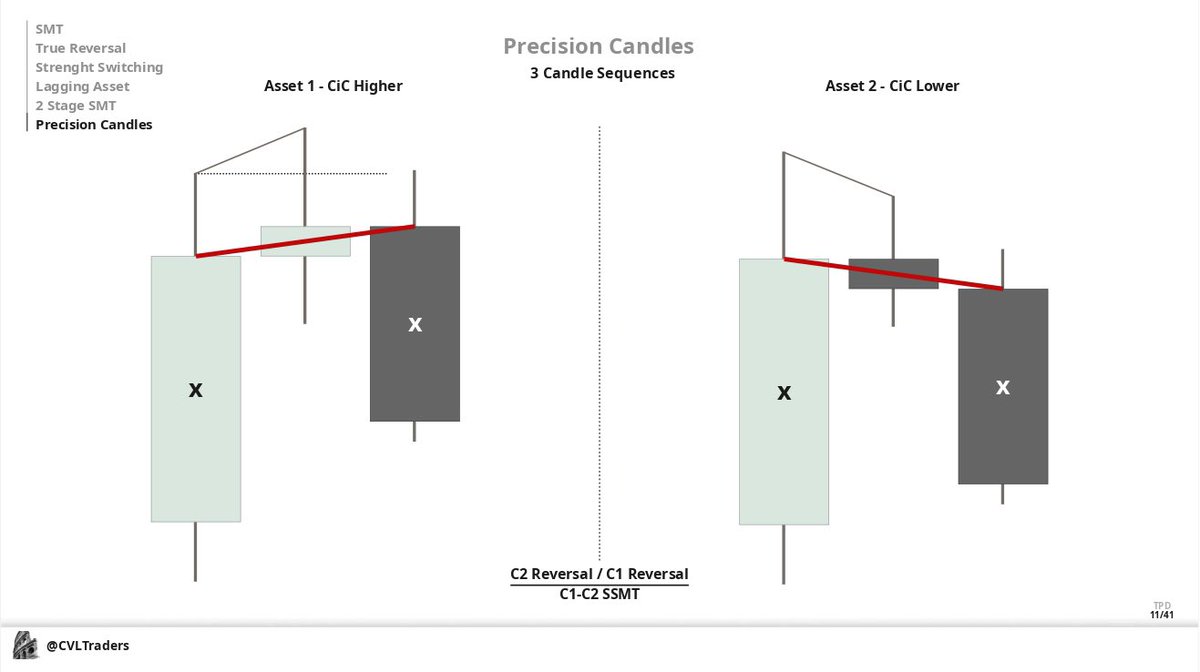
LTF Example of C2 Reversal / C1 Reversal: C1-C2 sSMT
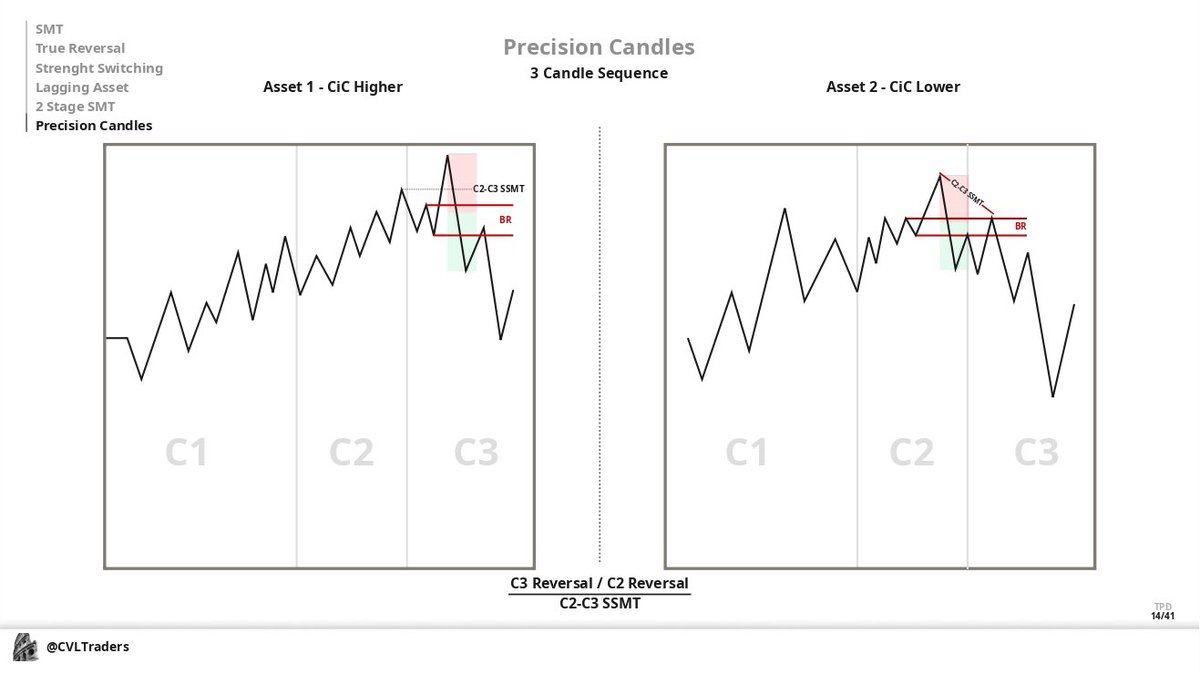
C3 Reversal / C2 Reversal: C2-C3 sSMT
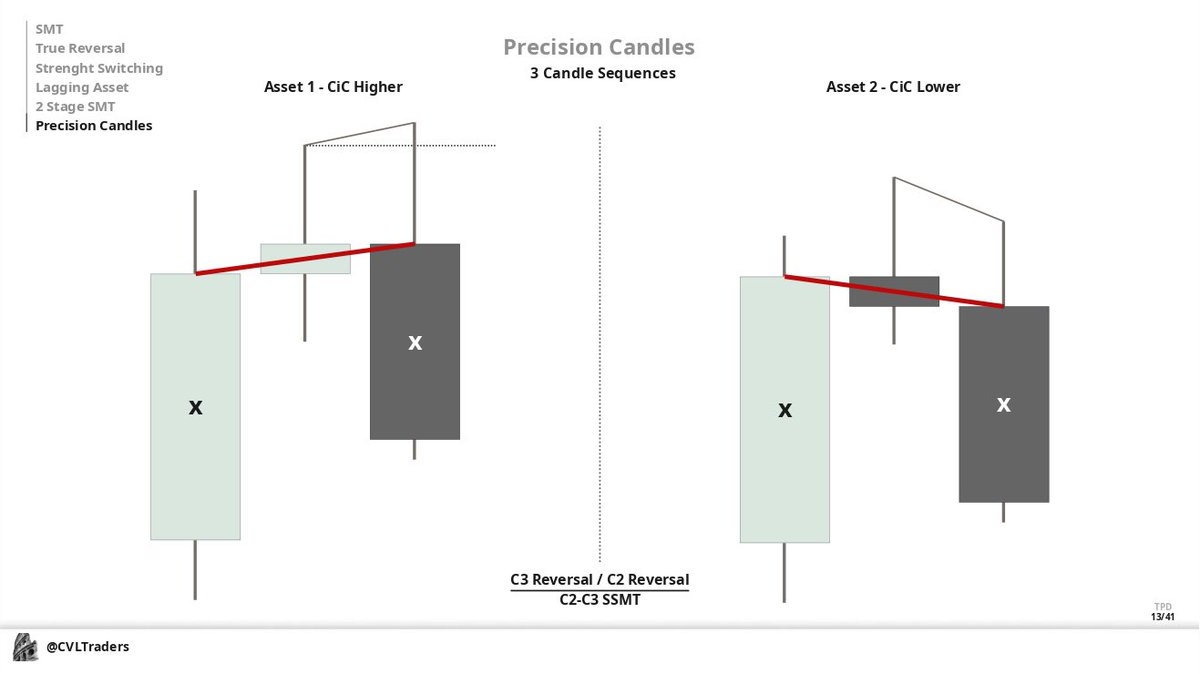
LTF Example of C3 Reversal / C2 Reversal: C2-C3 sSMT
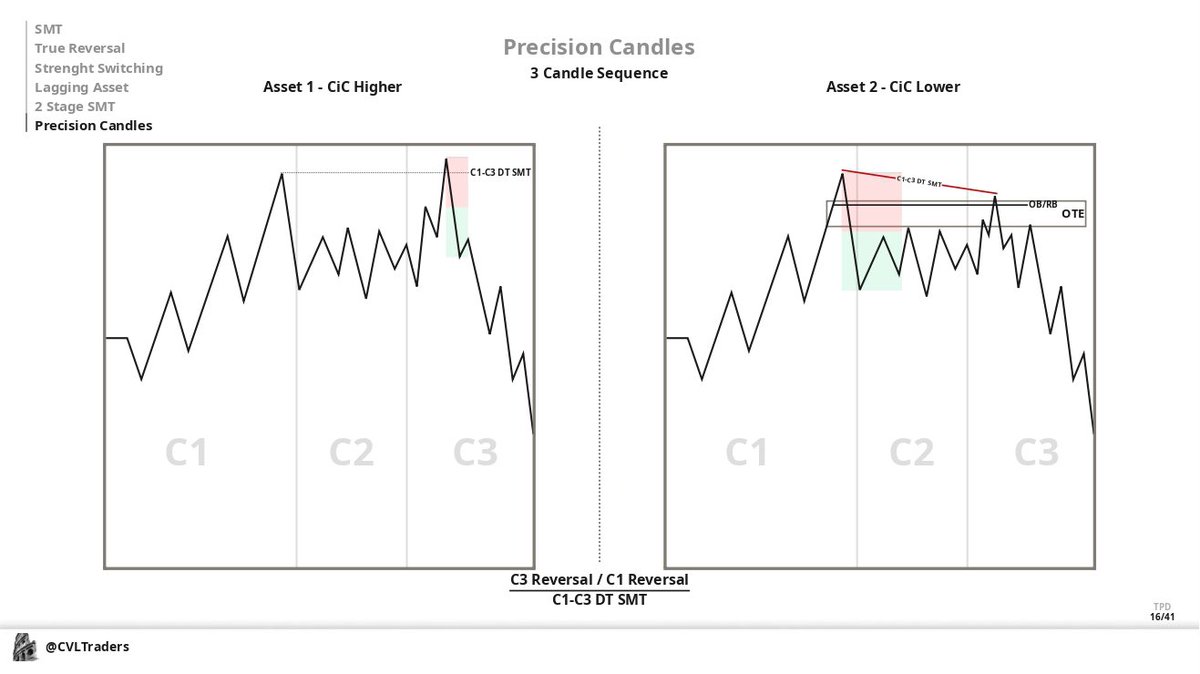
C3 Reversal / C1 Reversal: C1-C3 Doubling SMT
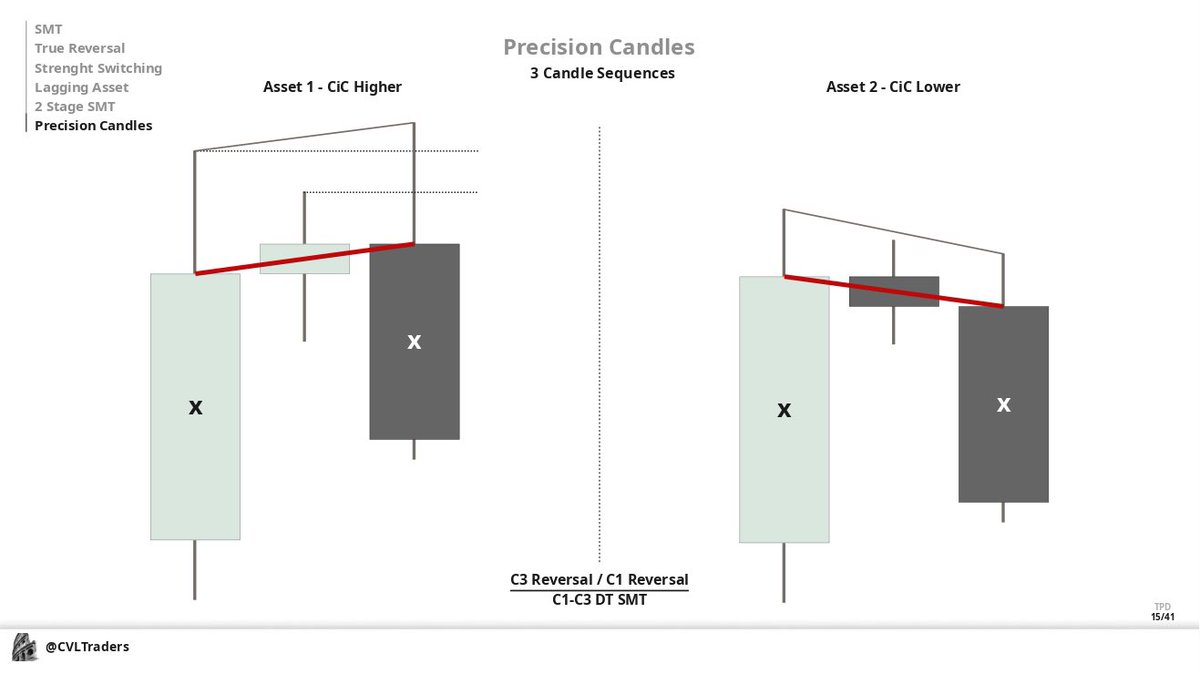
LTF Example of C3 Reversal / C1 Reversal: C1-C3 Doubling SMT
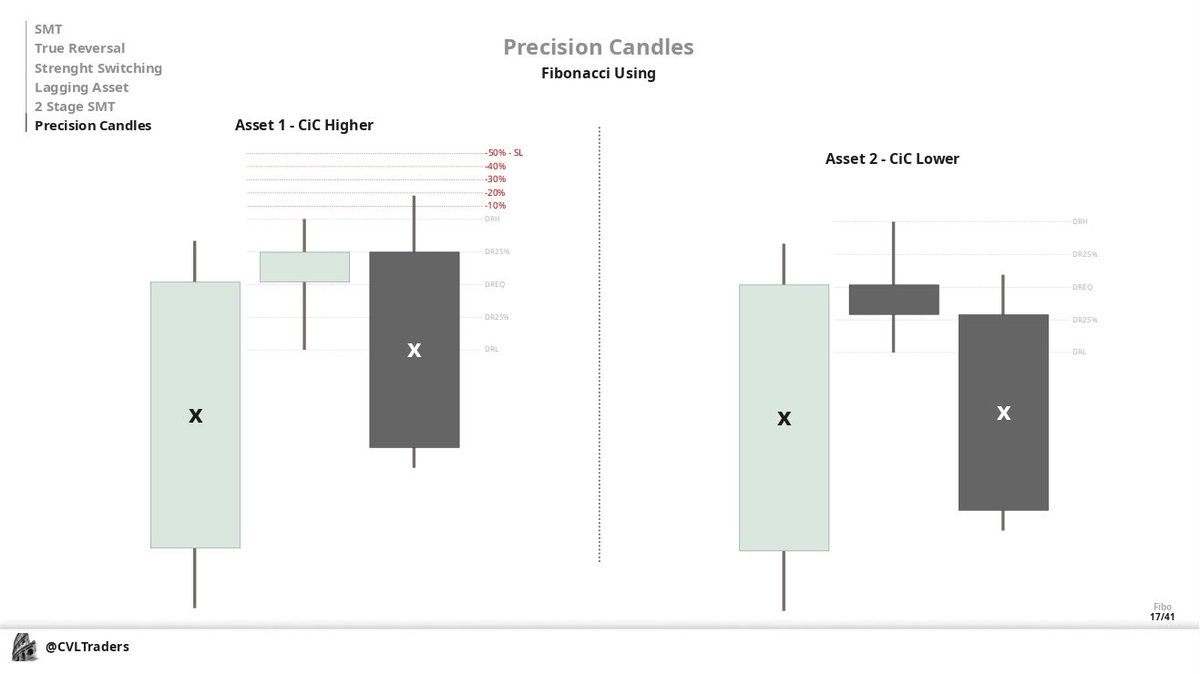
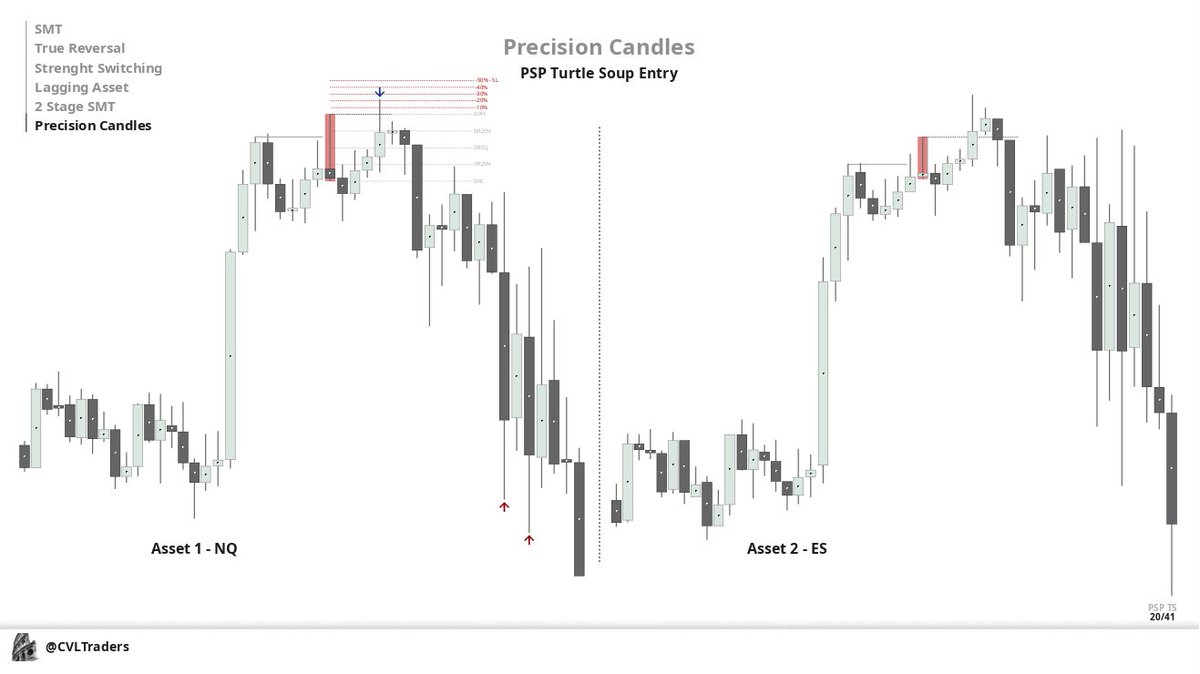
Fibonacci using Like ICT said: Algo runs 20-30% of the range So we can project Turtle Soup Fibo on your TPD ( -0.1, -0.2, -0.3, -0.4, -0.5 STD ) to catch the Turtle Soup Entry while sSMT occurs OR you can use C2 as your Dealing Range and work with it on LTF
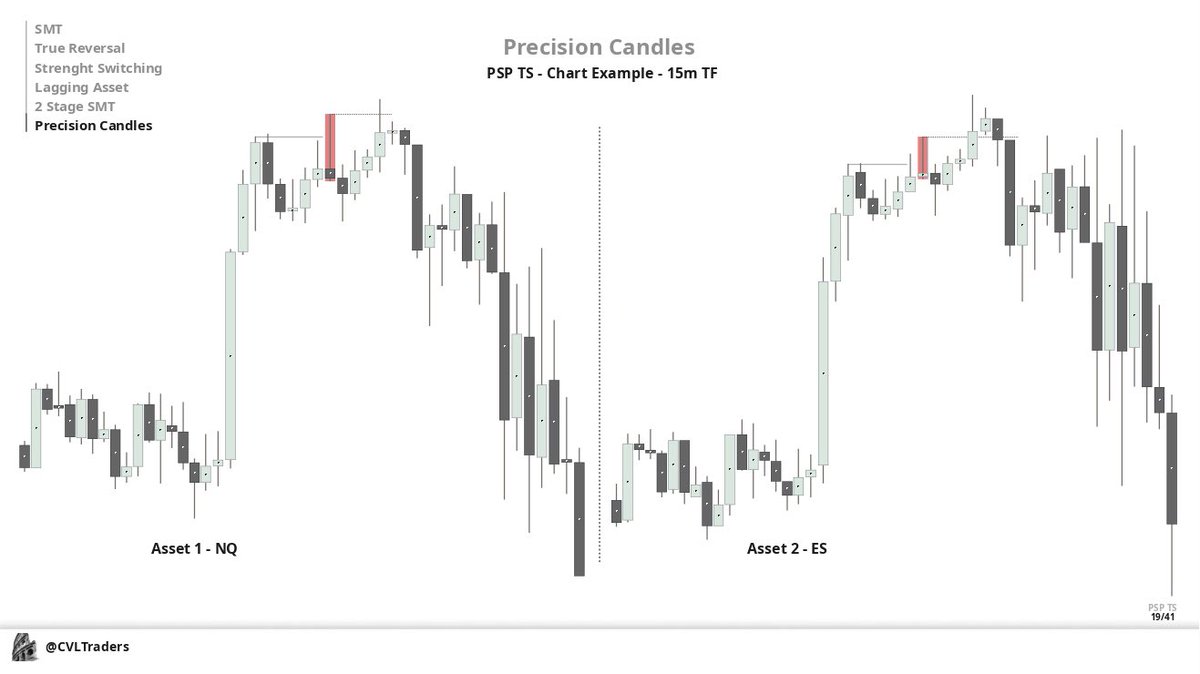
PSP Turtle Soup
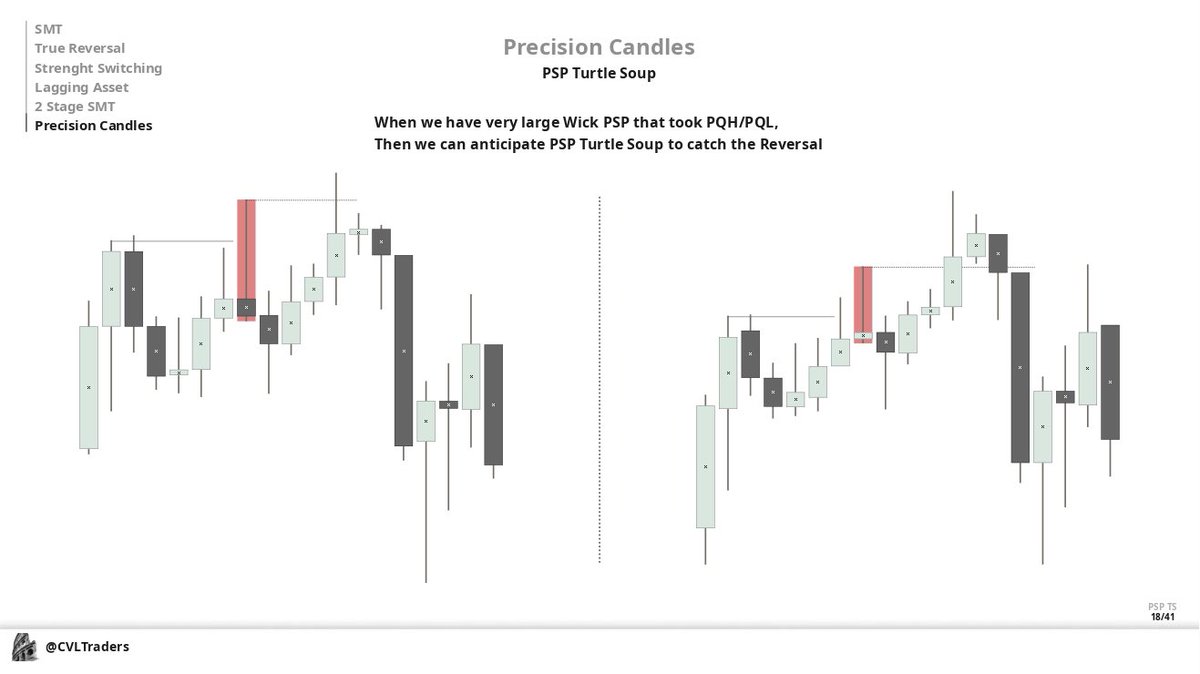
PSP Turtle Soup Chart Example:
PSP Turtle Soup Entry
TPD with big wick in Two NxOG's is very very high probability whenever we have TPD / sSMT within NDOG/NWOG/NMOW/Rollover Gap - it's high probability TPD because it's institutional algorithmic levels
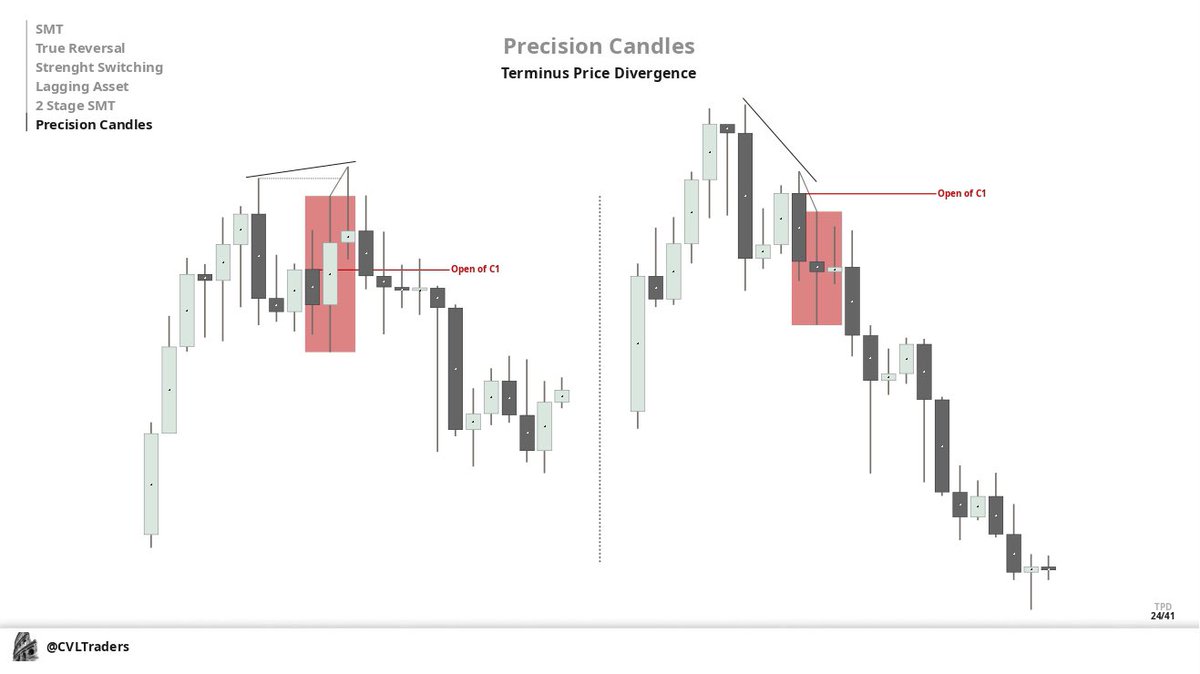
We can also project divergence within TPD from C1 Open to C3 Open to measure strength & weaknesses Like you see, we have sSMT between C1-C2

The asset on the left have Bearish Candle 2, also C2 is upper than C1 The asset on the right have Bullish Candle 2, also C2 closed by body below C1 that give us insight that is we likely to go lower on C3 and we as a result we have strong closure of C3, creating OB of C1.

Another example of using C1 Open, like you see left asset creates SMR when asset on the right creates a Re-Distribution It's perfect to see :)
TPD can be used in every sequence ( continuation / reversal ) Remember that is 3 Candle Sequence!
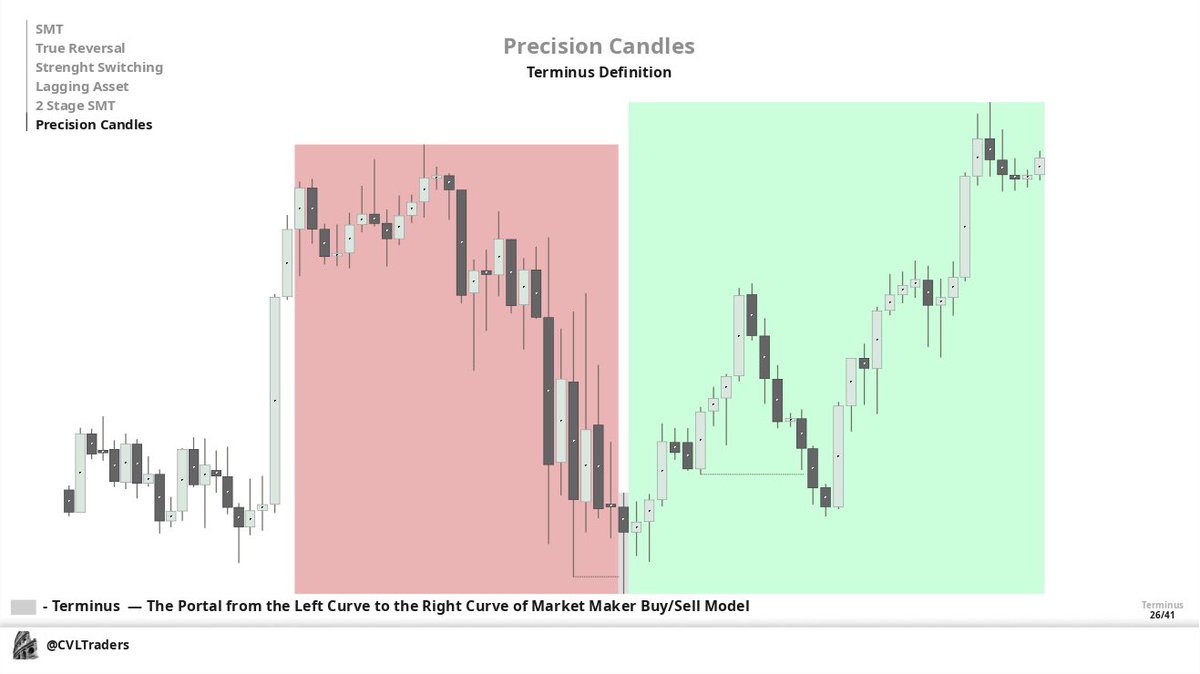
The Terminus — it's the endless point in space means that is endless point of Price blended with Time
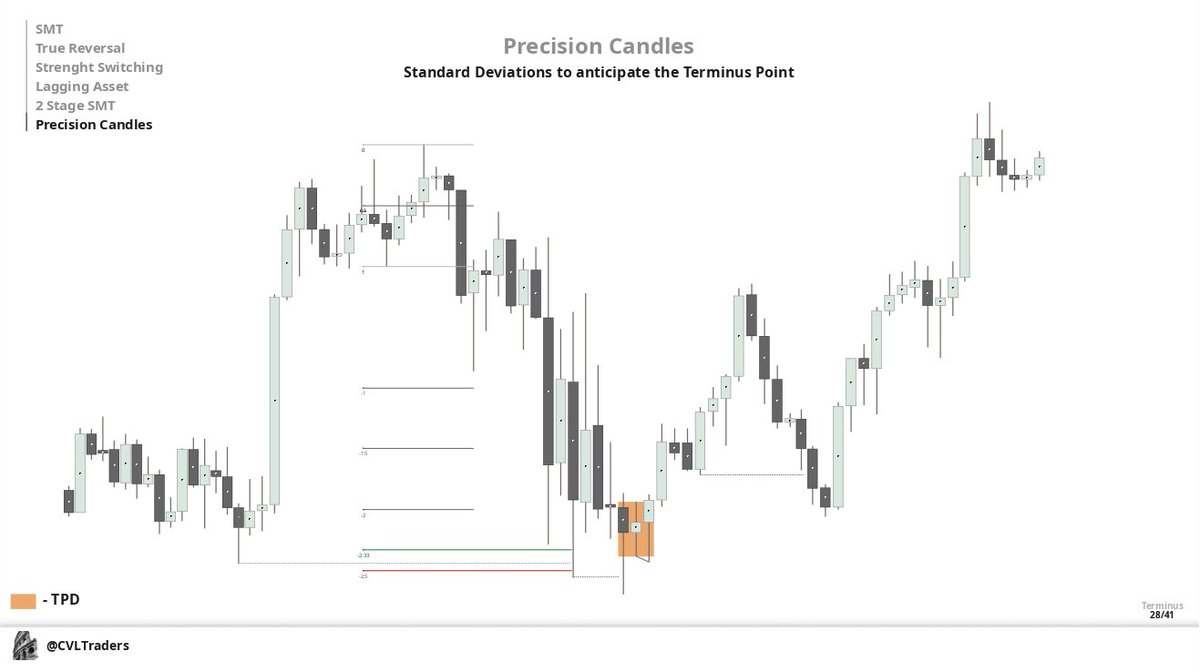
Like you see on example we have TPD C1 Reversal: C2-C3 sSMT

Of course we use STD to project Terminus. We likely to see the terminus between -2.0 — -2.5 STD / -3.5 — -4.0 STD
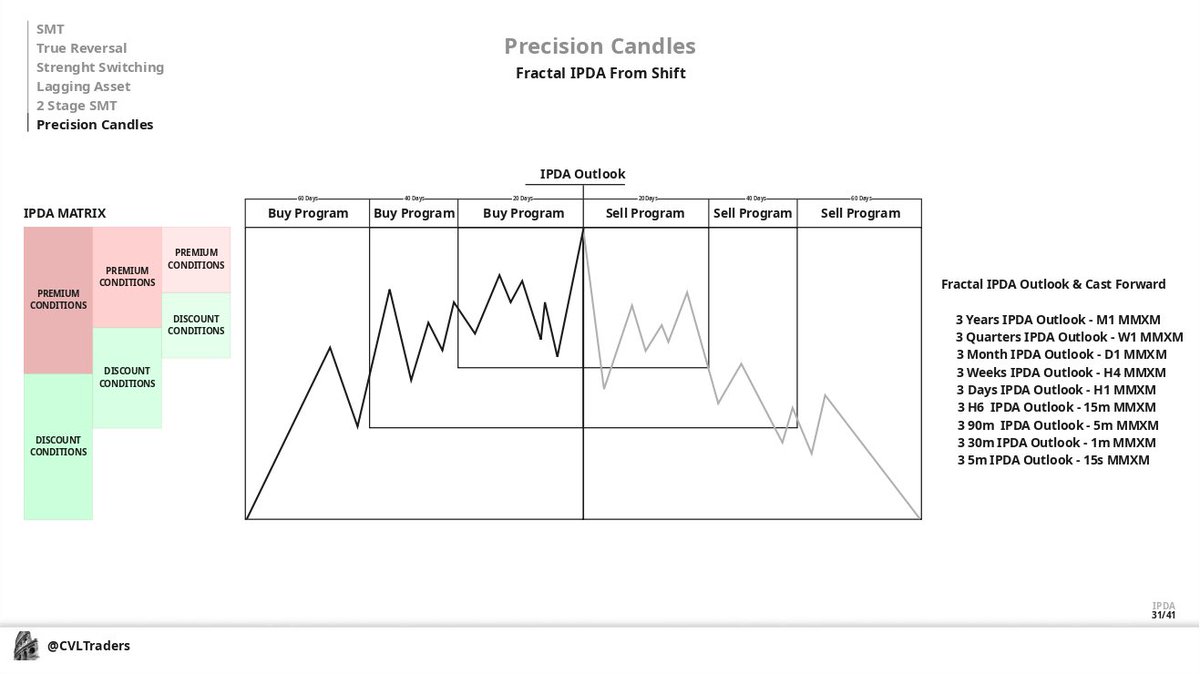
Fractal IPDA from Shift — like ICT said, we project IPDA from the Shift in Market.. so you can apply it fractally to have framework for MMxMs
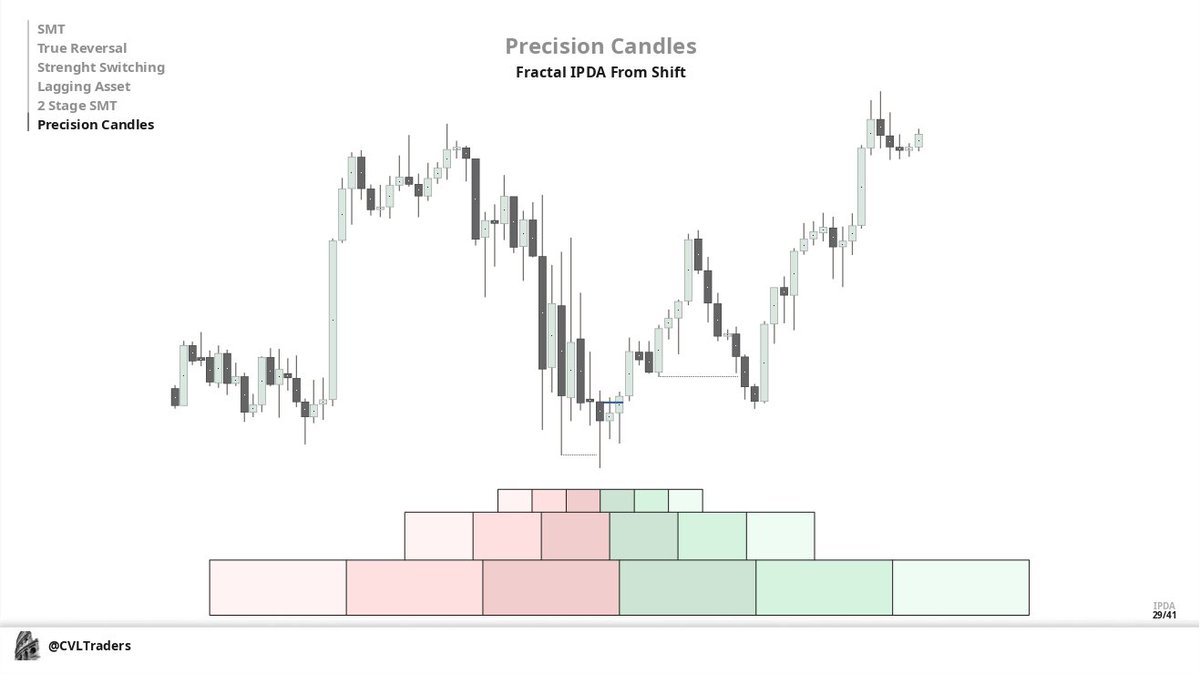
TPD usually have Shift by C3, so for this timeframe we measure IPDA from C3. But when you apply it fractally, you can understand that there's a MTF shift in C2, and LTF shift in C1, so we can anchor this IPDA fractal to use TAPDA & to lookback and cast forward with more accuracy

Here's Fractal Formula on how to use it.. Remember - Outlook and Cast Forward
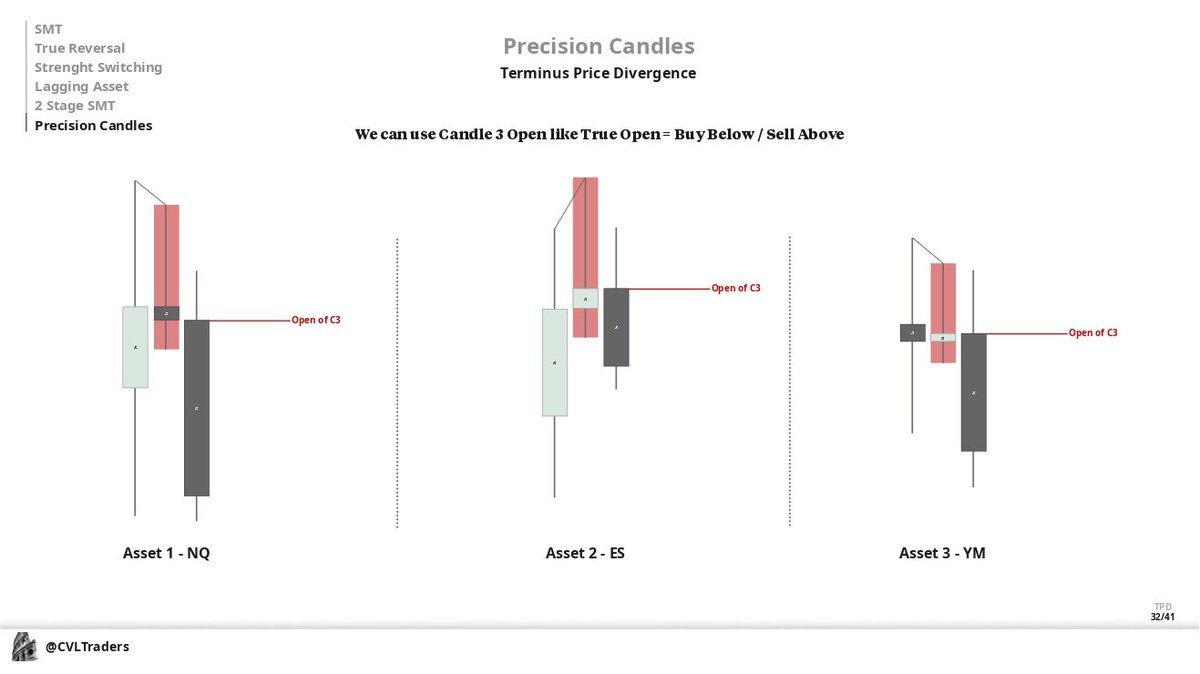
We can use 3rd Candle open as our True Open = Buy Below / Sell Above
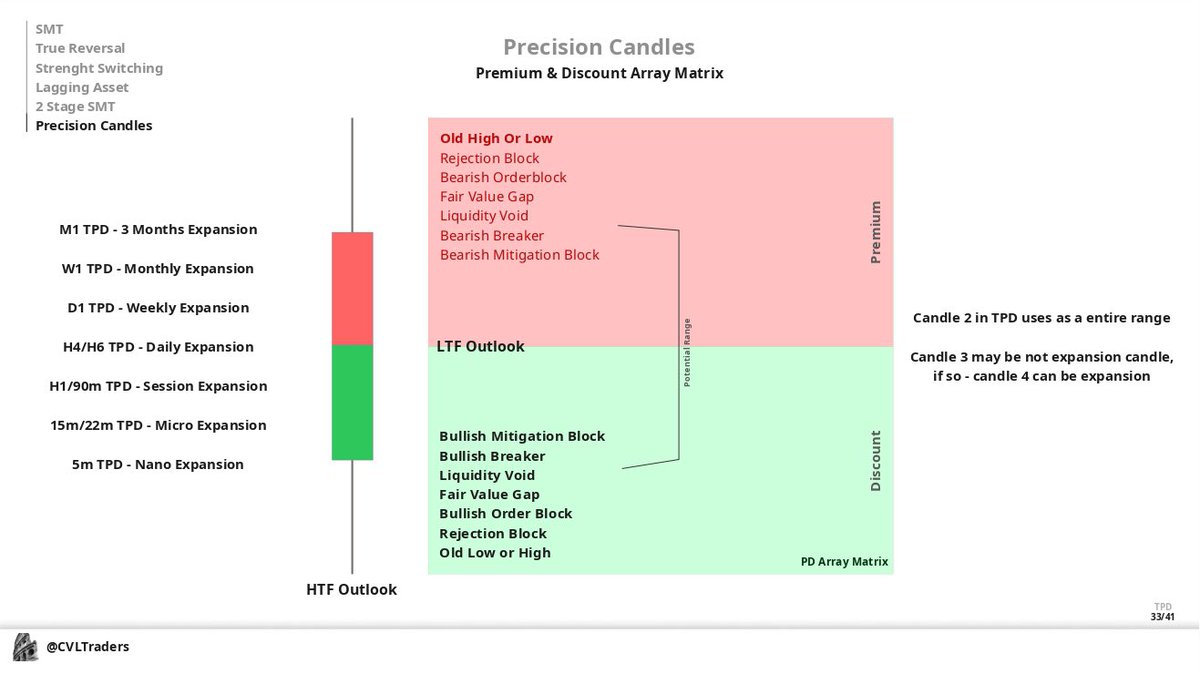
Premium & Discount Array on your TPD ( C2 ) If we have candle that closes inside of the range ( manipulation candle ) that would be a high probability PD Array Range
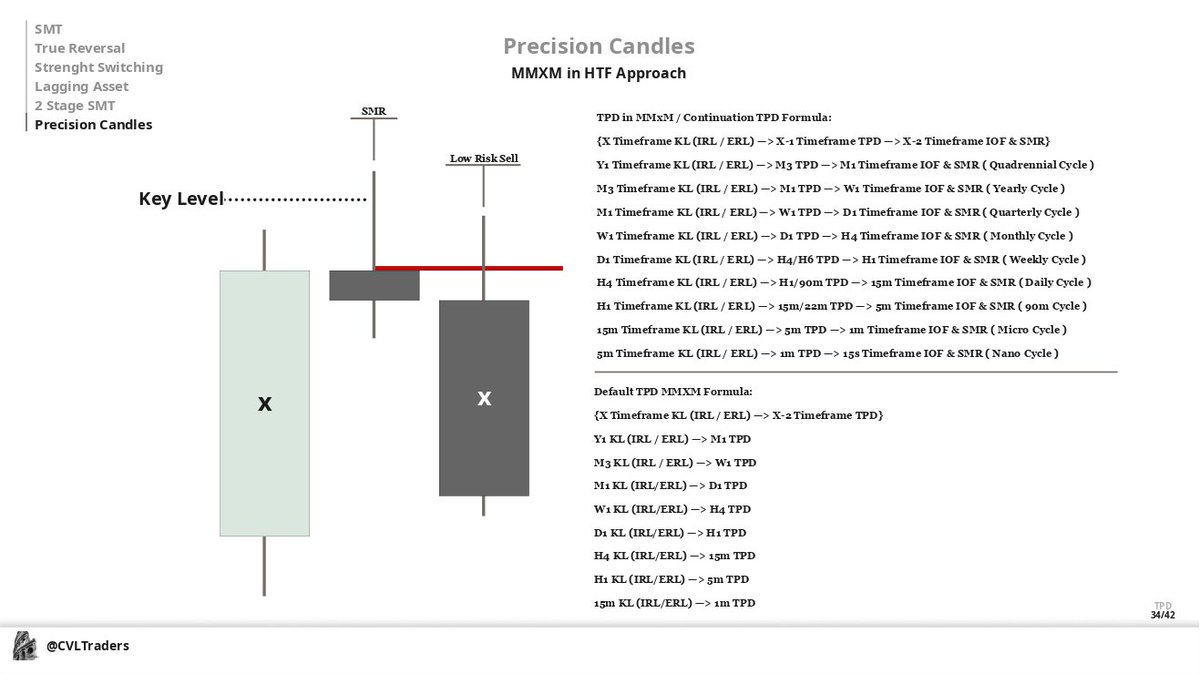
Here's example how you can see the LTF MMxM stages within TPD Sequence in HTF Approach
2 AM H4 TPD — it's align with a Daily Quarters 8 AM H1 TPD — It's Bonds Opening Range ( BOR ) 9 AM H1 TPD — Opening Bell & Index Opening Range ( IOR ) 8:30 30m TPD — News Embargo 9:30 30m TPD — Same as 9 AM H1 TPD 13:30 30m TPD - PM Opening Range ( PMOR )
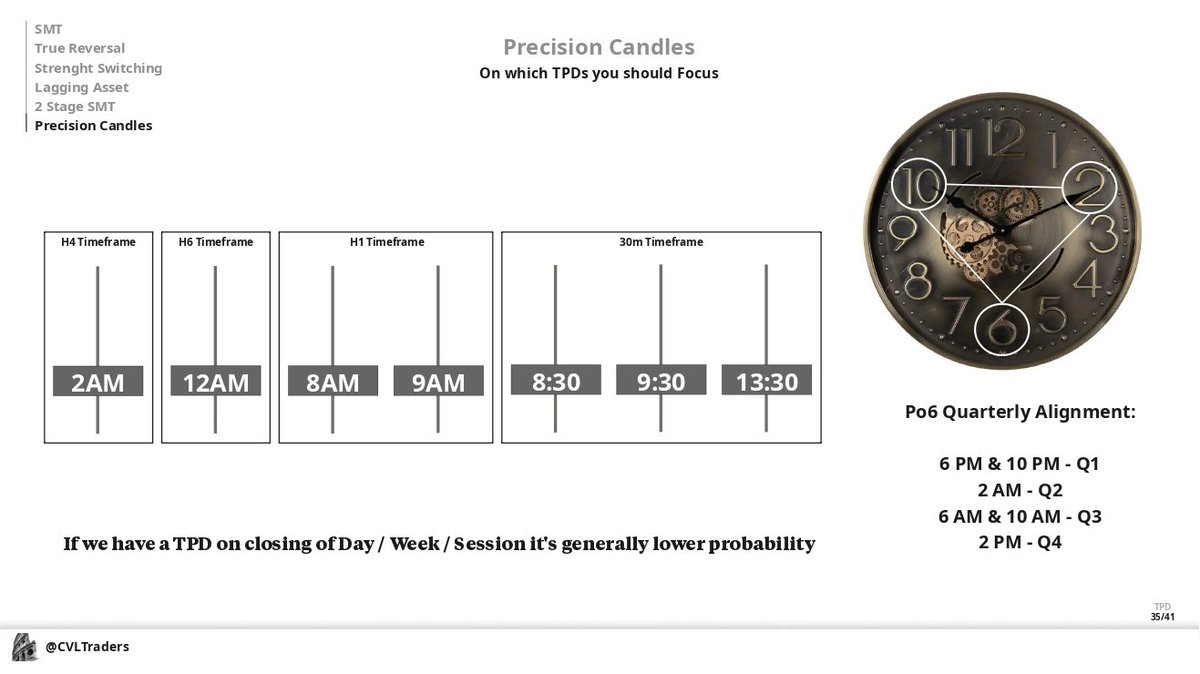
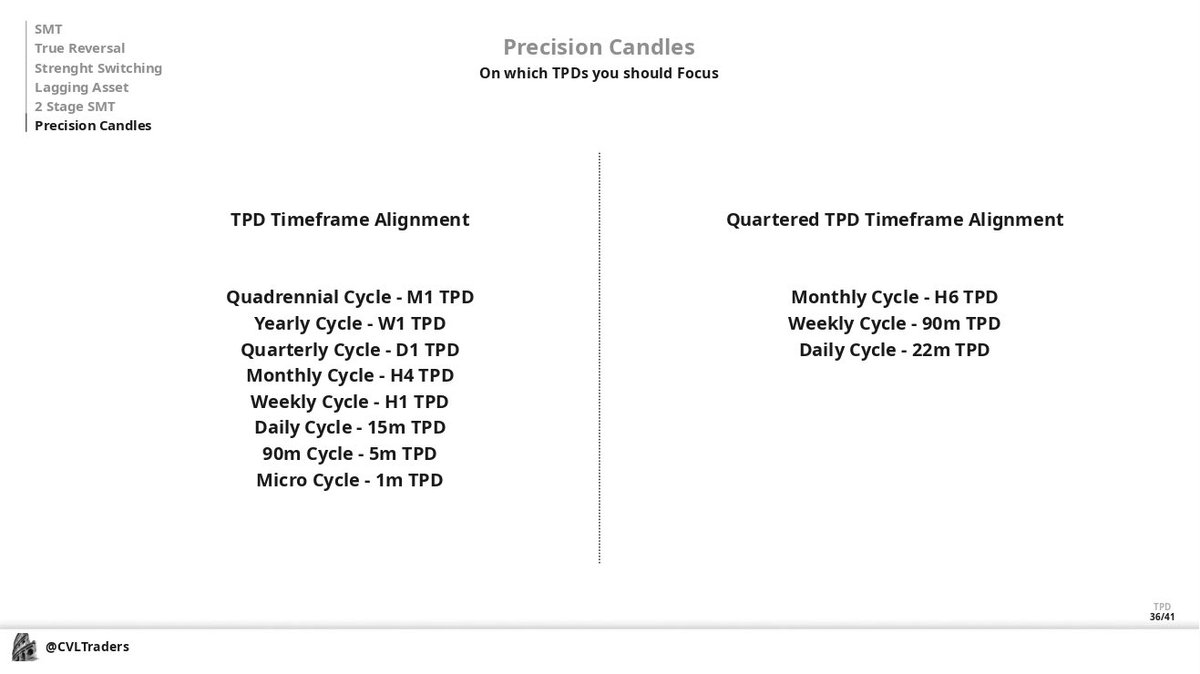
TPD Timeframe Alignment: