
This cycle feels... different. Why are the old methods not working? I spent 27 hours digging into the past. Here’s what I found (and what I’m doing now) 🧵👇

As we get started, may I ask for a quick favor? I've put a lot of time in research to create this and would appreciate any interaction with the thread. Bookmark, like, or reply to the first tweet.

I've spent over 7 years in crypto, watching 30+ on-chain and macro signs that usually pop up before a big top. I also follow 12 patterns in behavior and media that often show up late in the cycle. Right now, none of the key on-chain signs look risky. Here’s how to tell before
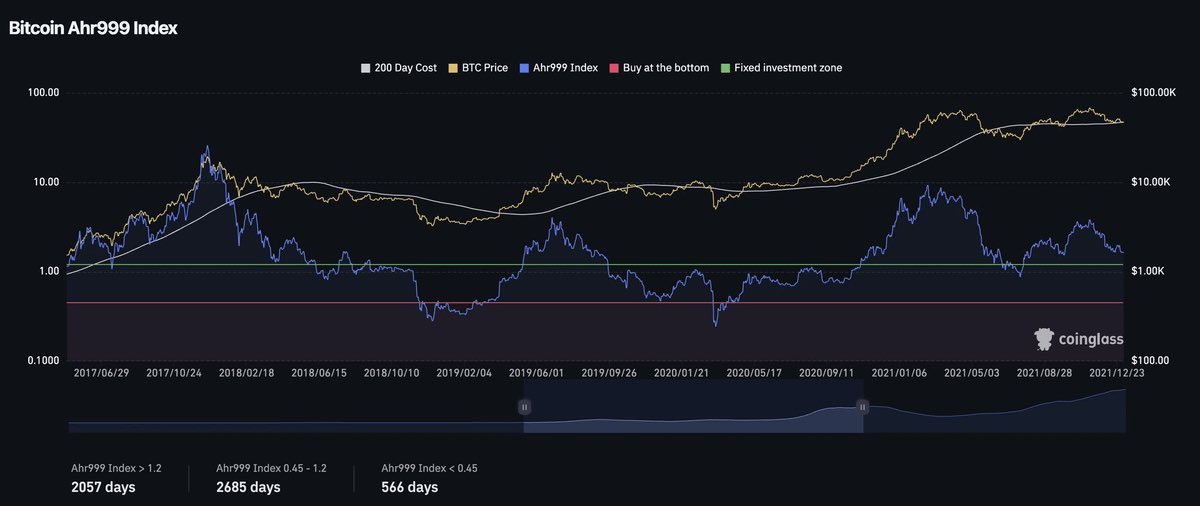
Bitcoin’s Ahr999 is now at 1.21 – still far from the 4+ range where things heat up Pi Cycle Top is around 65% of its alert level at 182,957 Puell Multiple sits at 0.95 – tops usually hit when it's past 2.2 Rainbow Chart has us in Zone 2 – tops show up around Zone 5+
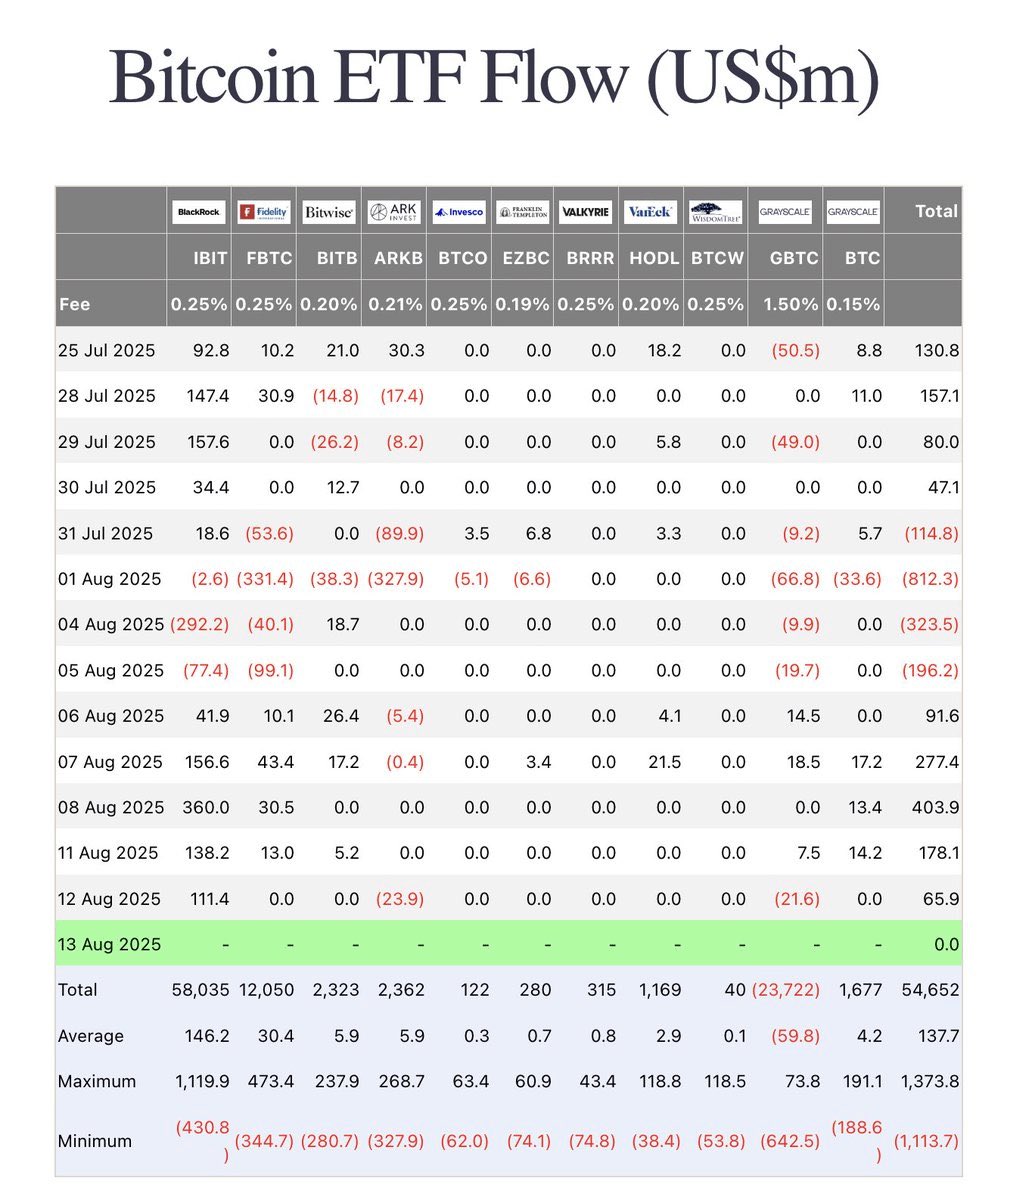
ETF outflows have only lasted 1 day so far - risk builds after 10+ days in a row ETF-to-BTC Ratio is sitting at 4.92% - it gets concerning when it drops under 3.5% 2-Year MA Multiplier is at 229,253 - warning zone kicks in above 349,456 MVRV Z-Score is 2.4 - past tops formed
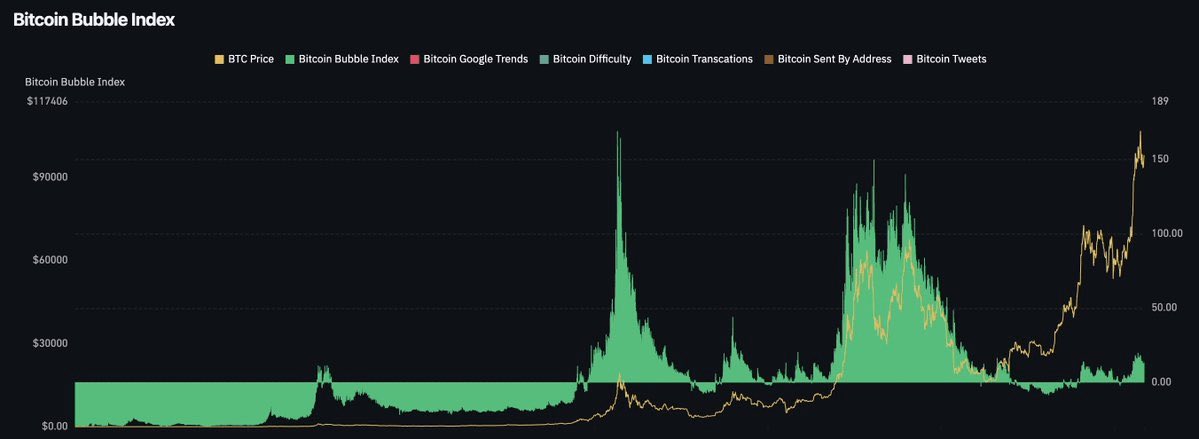
Bitcoin Bubble Index – currently 13, danger zone begins at 80+ USDT Flexible Savings – 7.65%, overheat signals appear above 29% RSI 22-Day – 63, risk emerges above 80 Altseason Index – 51, altseason typically starts at 75
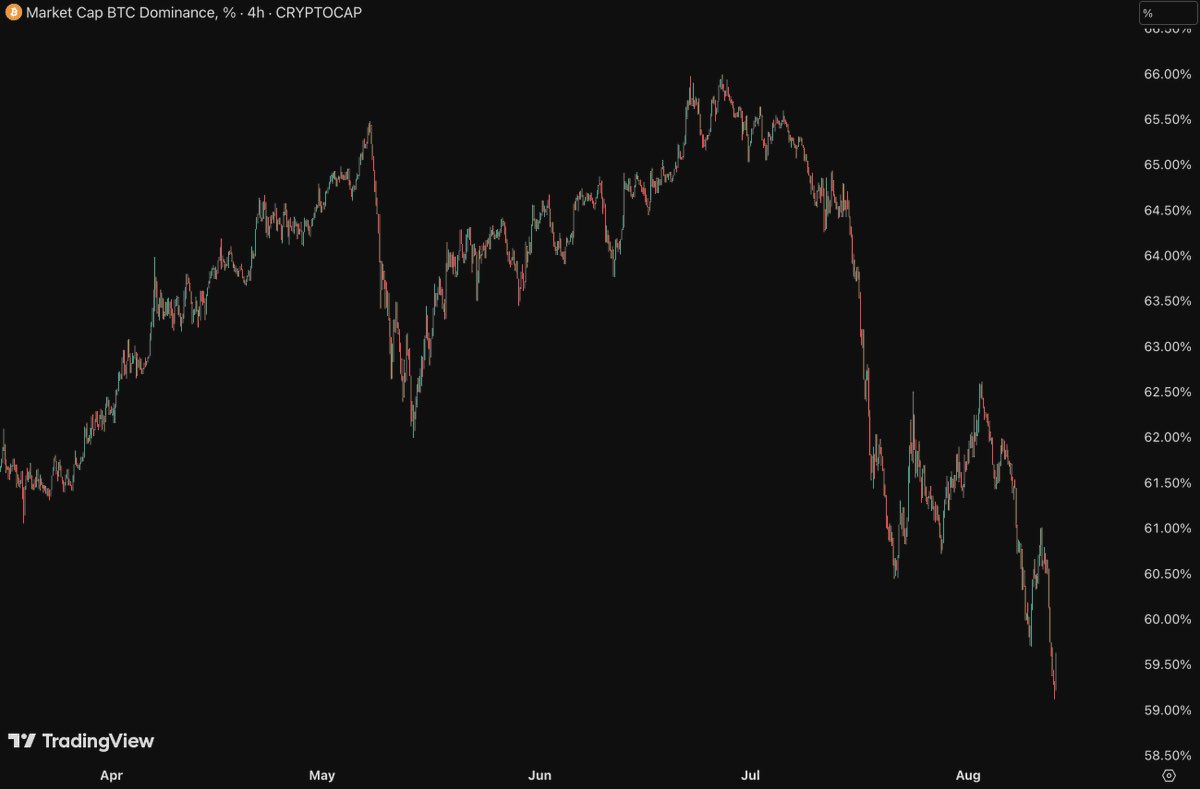
Bitcoin Dominance is at 58.84% - it usually makes a final surge past 65% before a cycle top Long-Term Holder Supply sits at 15.62M - danger shows up when it falls below 13.5M Short-Term Holder Supply is 21.51% - risk starts building once it crosses 30% Reserve Risk is 0.0023 -
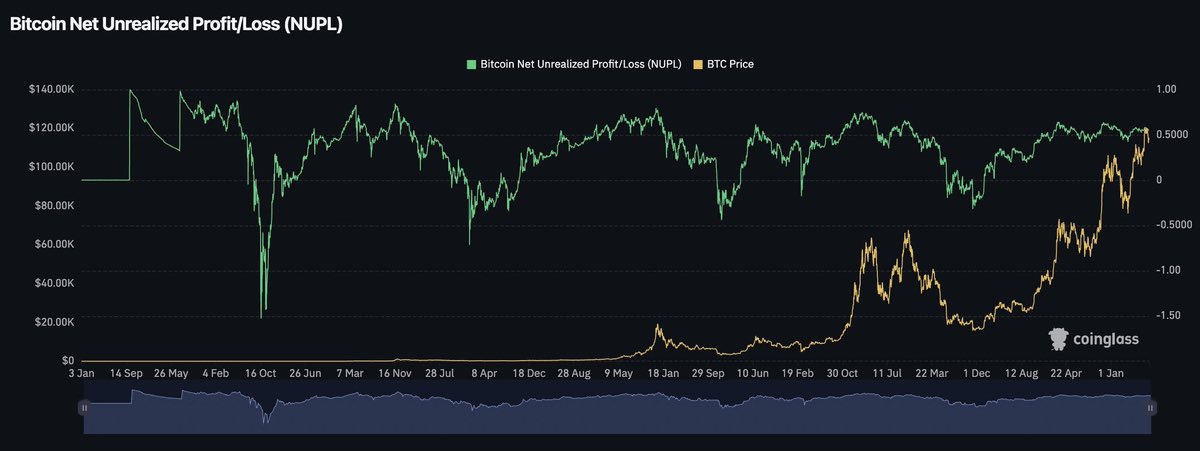
NUPL is at 54.91% - the euphoria phase usually kicks in after 70% RHODL Ratio stands at 6,915 - past peaks formed when it crossed 10,000 Macro Oscillator reads 1.07 - risk tends to rise once it’s above 1.4 MVRV Ratio is now 2.32 - danger often starts beyond 3
4-Year MA Multiplier is at 2.35 - caution zone begins once it climbs past 3.5 CBBI Index reads 79 - major peaks usually form when it hits 90 or higher Mayer Multiple is sitting at 1.17 - overheated levels start above 2.2 AHR999x Top Escape is 2.04 - serious risk shows up below

MicroStrategy’s average buy price is $82,377 - past tops were nearly double that Bitcoin Trend Indicator is at 6.14 - it starts flashing red beyond 7 3-Month Annualized Ratio sits at 9.95% — risk typically rises over 30% Bitcoin Terminal Price is $65,730 - estimated cycle top

Golden Ratio Multiplier is at $121,971 — risk starts showing up past $135,522 Smithson’s model shows $53k now, with a possible top between $175k and $230k Bottom line: core indicators still haven’t entered the danger zone Up next, we’ll break down key sentiment and behavior
Right now, all 30 key signals look safe - no need to stress When 20 or more flip red, that’s your cue to start exiting fast Don’t aim for the perfect top - it’s smarter to lock in profits early
Join my FREE trading community! We drop signals & undervalued gems with massive potential🚀 🔗 Join our Telegram: http://t.me/mastercryptohq
If you found this thread helpful, don't forget to: ➮ Follow @MasterCryptoHq for more such contents. ➮ Like/Bookmark/Repost the quote below if you can. https://x.com/mastercryptohq/s...
@MasterCryptoHq Bro, please give us an alert of exit time
@MasterCryptoHq Bhai aapke is post ke baad Dil halka ho gya
@MasterCryptoHq Bhai aapke video ka wait kr rahu hu aa nhi rahe kab kr rahe ho fir comeback 🤔🤔
@MasterCryptoHq Thank you