
The Relative Strength Index is one of those indicators traders constantly keep an eye on because it shows when momentum is strong, when it’s fading and when things might be stretched. It moves on a scale between zero and one hundred. Readings above seventy are usually called

Subscribe to my Substack for in-depth weekly analysis and insights. @stockmktnews?r=5o9hox&utm_medium=ios&utm_source=profile class="text-blue-500 hover:underline" target="_blank" rel="noopener noreferrer">https://substack.com/@stockmkt...
@_Investinq @grok Which market sectors are the best to trade right now? Examples: Financials, Consumer Discretionary, Nuclear.

@_Investinq The gap at 50% will be filled. #SPX
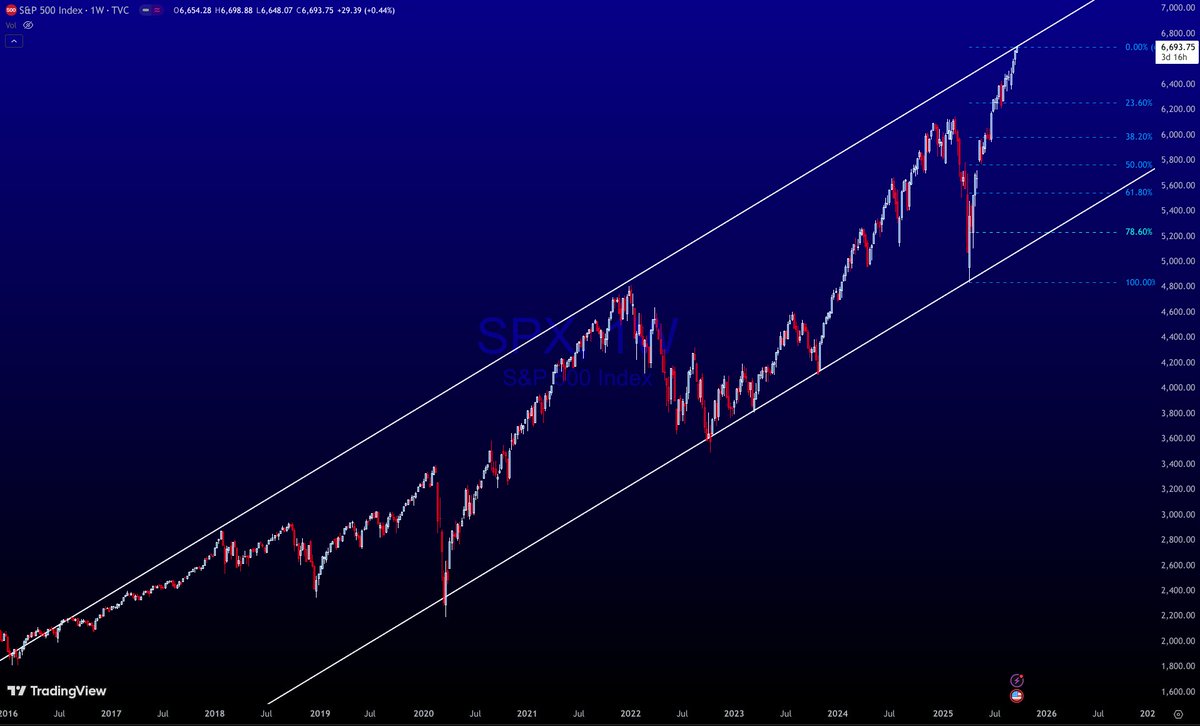
@_Investinq I appreciate how you’ve framed this as part of the market’s natural rhythm, Mel. As long as the resets are fair and not too dramatic, and we exercise caution by taking a wee step back, they seem necessary.
@_Investinq Now do RSI on weeklies and monthlies. Into the 70s for most of the last 18 months, except for last spring.
@pedro_deleon54 Very specific lol
@_Investinq Yeah, it's a classic for spotting those overbought signals. Reminds me of a great breakdown @cameron_brooks5 did on how RSI can diverge from price action.
@_Investinq @_Investinq, great insights on the relative strength index and its significance for traders!
@_Investinq S&P 500 shows rare RSI strength streak—short-term pullback likely, but long-term trend remains intact.
i see what you guys are doing: *NVIDIA TO INVEST UP TO $100B IN OPENAI

This is concerning: US aggregate weekly hours worked has fallen -0.2% over the last 3 months, the largest decline since the 2020 pandemic. This indicator measures the total hours employees work in a week, reflecting overall labor market activity. A drop in hours often
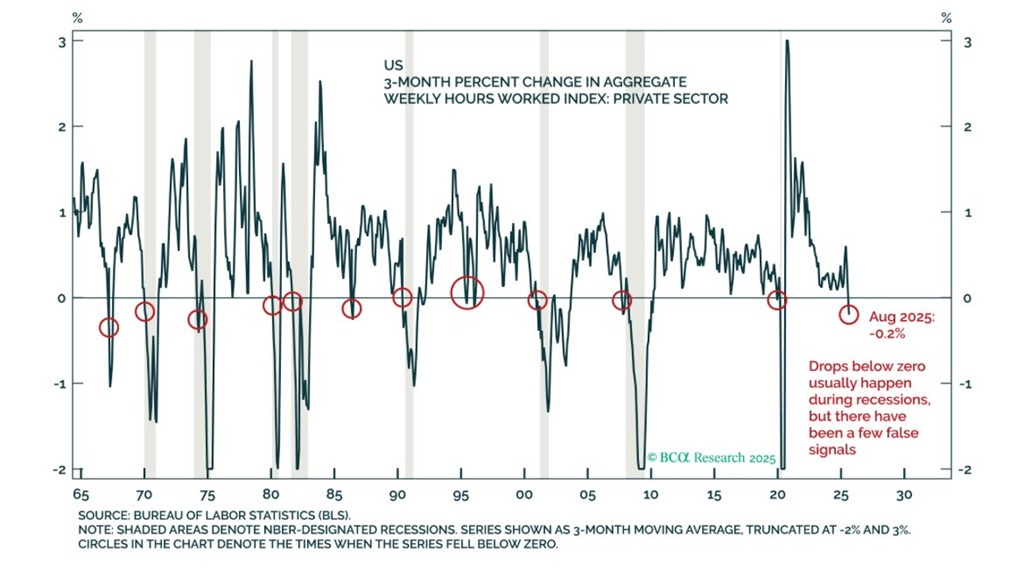
While everything looks like we have the "all-clear" for equity investors. The 10Y–3M curve is still turning higher as short rates roll over. Every major recession in modern history has followed this late-cycle bull steepening pattern. There’s never been a cycle where this

BREAKING: "A third of US states may already be in a recession," per FT