
In this THREAD I will explain “Order Flow” 1. Footprint Charts 2. Open Interest 3. Market Profile 🧵(1/14)
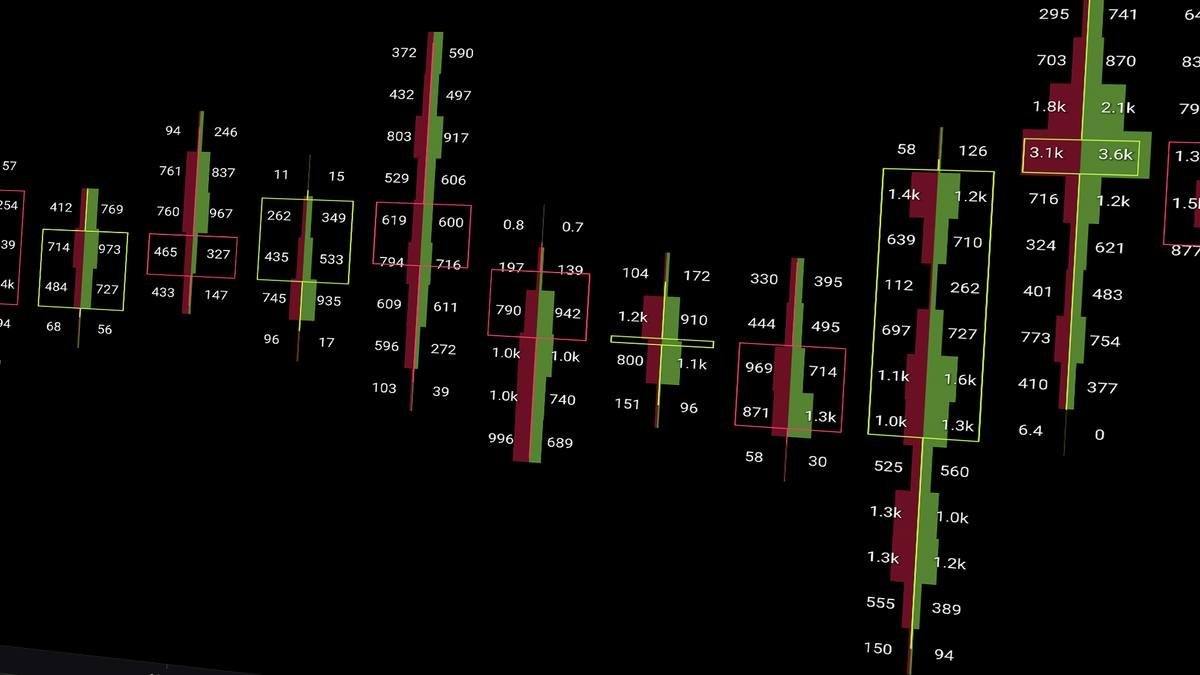
1. Footprint Charts One of the most important features incorporated into the Footprint candle is Delta. Computes the net imbalance between buying and selling activity for every price in the candle. A positive delta indicates that buyers are pushing the market.

1.1 Footprint Charts Footprint charts reveal order flow by showing volume at each price level. This chart shows buyers (green) vs sellers (red), total volume, and Delta (net buying/selling pressure) Great for spotting absorption, imbalances, and key levels
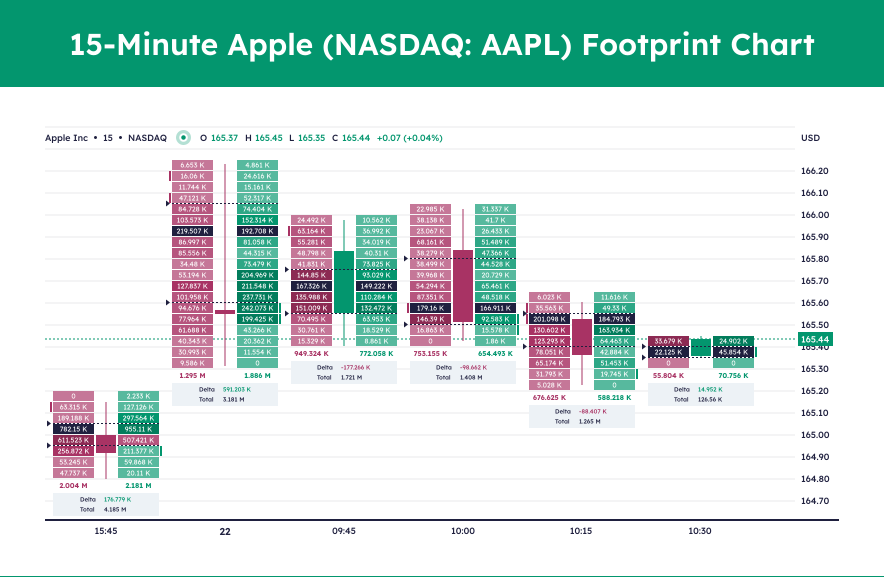
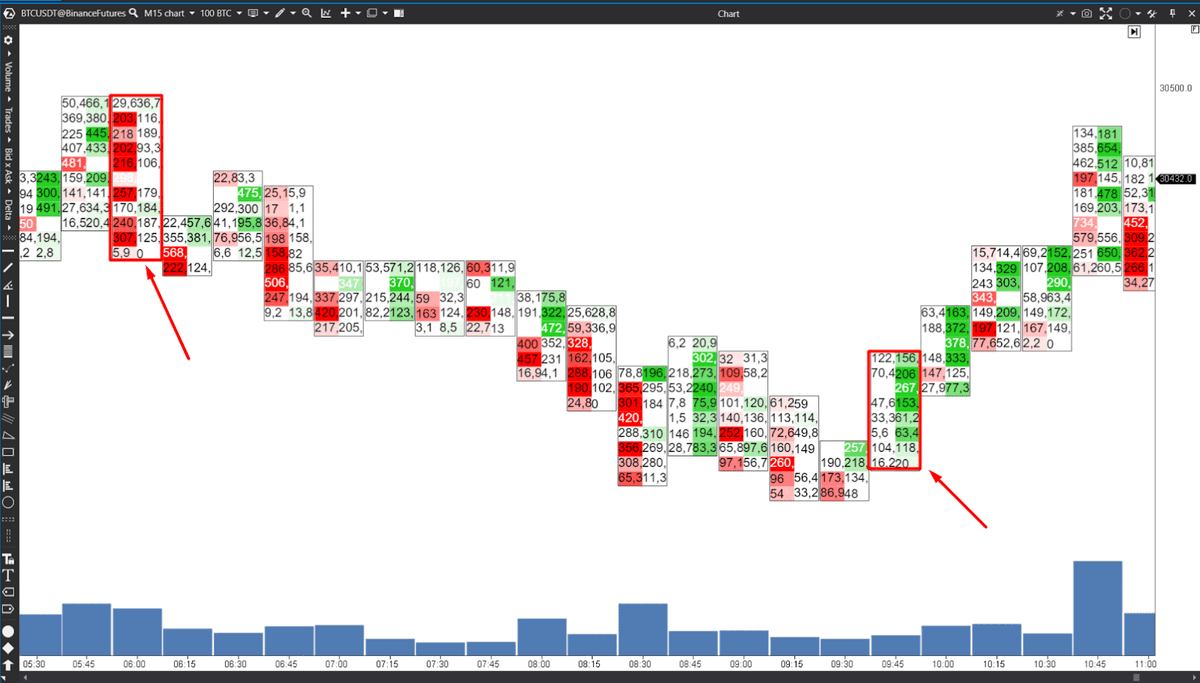
1.2 Footprint Charts In a bearish market, track negative Delta values to identify downward price movements. A larger negative delta indicates a stronger downward momentum. Which potentially signals an opportunity to open a short position or sell.

1.3 Footprint Charts In a bullish market, look out for positive delta values to identify upward price movements. A larger positive delta indicates a stronger upward momentum. Which potentially means an opportunity to open a LONG position or buy
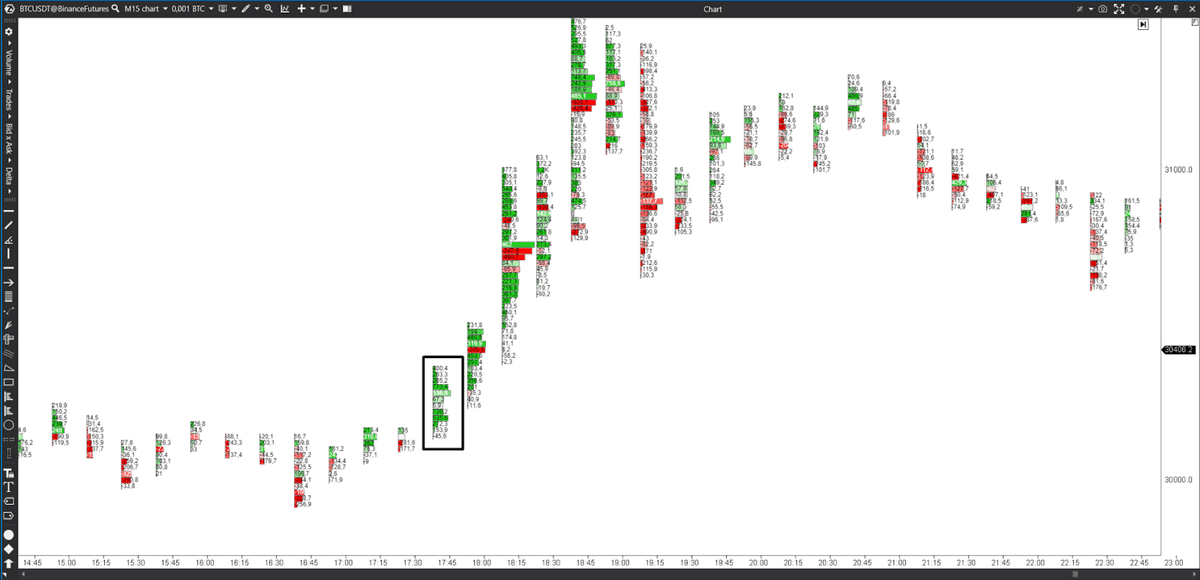
1.4 Footprint Charts When buying volume is stronger than selling at key price levels, it shows bullish sentiment and upward movement. If selling dominates, it signals bearish pressure and potential downside. Footprint charts help spot these shifts in real time.
2. Open Interest To read Open Interest effectively, combine it with Price and Volume: Price ↑ + Volume ↑ + OI ↑ = Strong uptrend Price ↑ + Volume ↓ + OI ↓ = Weak uptrend Price ↓ + Volume ↑ + OI ↑ = Strong downtrend Price ↓ + Volume ↓ + OI ↓ = Weak downtrend

2.1 Open Interest Open Interest measures open derivative contracts. Increasing OI suggests fresh capital and trend continuation. Decreasing OI signals liquidation and potential trend exhaustion.

2.2 Open Interest Open Interest Flow Sentiment measures net inflows vs outflows of positions. Positive values mean inflows dominate; negative values mean outflows dominate. Distance from zero indicates how strongly one side prevails and the market’s conviction.

2.3 Open Interest Open Interest Flow: Left, outflows with positive correlation; price falls and OI drops, showing exits. Right, inflows with negative correlation; price falls while OI rises, showing new short entries. Distance from zero indicates degree of dominance.

3. Market Profile TPO Profiles: A TPO profile is a market profile visualization. Details how much time was spent at each price level throughout the time interval.
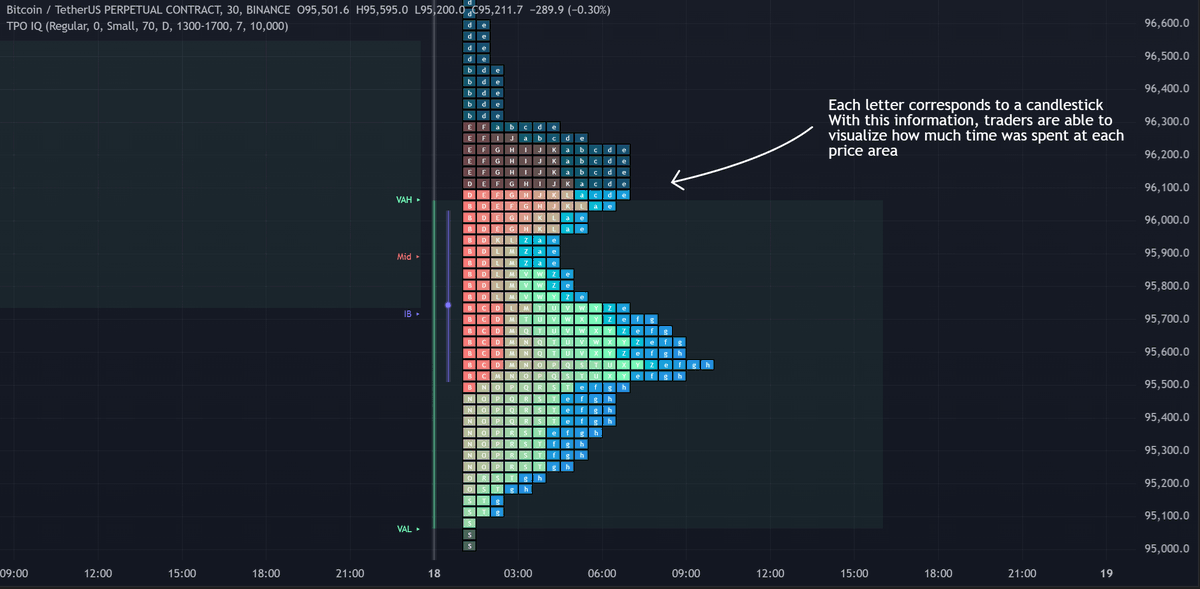
3.1 Market Profile Initial Balance: TPO IQ also identifies the initial balance range and all alphabet characters that form within it The initial balance range is denoted by a a neon-blue line, with a blue circle showing the opening price.
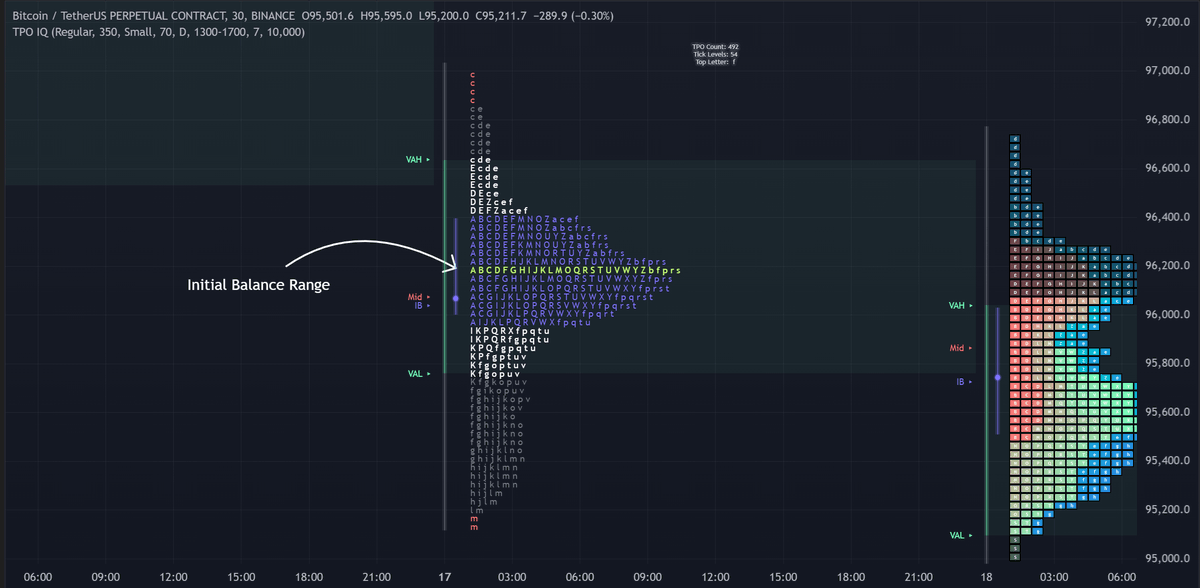
3.2 Market Profile Value Area TPO IQ also identifies the value area of the profile. The value area of a TPO profile shows where price traded the majority of the time.

I'm going to publish a PDF this week about Order flow in Telegram. This Thread was a brief introduction about the PDF. If you learned with this THREAD: LIKE, RT and COMMENT the first tweet of the THREAD to share it.
@SoulzBTC Footprints are a cheat code for anyone wanting to trade lower timeframes I don't use them in my daily routine trading anymore but for any beginner scalper, it's the first tool that shows you how a market is made and just watching the footprint charts explains more to people
@BullyDCrypto Totally, as a beginner I also studied and traded with footprints Makes you understand how and why the price moves, and if you combine it with CVD or OI it’s really useful
@SoulzBTC You know it’s about to be a great thread when there’s more bookmarks than likes 👍
@habezcrypto Thank you 🤝🏽
@SoulzBTC Great thread bro. Thanks. I've been paying more attention to the Footprint section lately. I've refreshed my knowledge :)
@EfloudTheSurfer Thank you! It’s an honor coming from you Footprints are really useful to identify trends before they happen
@SoulzBTC will print the pdf, this is a masterpiece
@stecryptoshaman Thank you brother 🤝🏽
@SoulzBTC 🔥🫡
@dd_finance Thank you bro 🤝🏽
@SoulzBTC Great thread about order flow! Have to look into this more myself. Love the details! What's your favorite platform to analyze order flow?
@CryptelligenceX Thank you brother! Kiyotaka is very useful for it. Also Exocharts I will release this week a Indicator on Footprints 🤝🏽
@SoulzBTC Sometimes I'm enjoying reading your threads. Always to the point with no "Pro-trading" BS. Your posts are really helpful
@300Sn98742 Thank you 🤝🏽
@SoulzBTC Pl update yr pdf also on yr discord bro we are waiting
@YamanKhan323759 I will post the PDF in Telegram and Discord when it’s ready 🤝🏽
@SoulzBTC Nice thank you!
@SoulzBTC u gonna name the indicators or what? there are alot on tv bro
@SoulzBTC Very well written, How can I identify the moment during a pump when the market is declining so that people have time to sell, other than the candlestick shadow? What else signals this? Indicators are lagging.
@SoulzBTC Thank you very much sir 😊🙏🏻 a breakdown tutorial video on your YouTube or telegram channel will help alot ❤️🩹also drop your YT channel handle 🙏🏻🙏🏻🤍
@SoulzBTC How to add this into our chat or in tradingvie