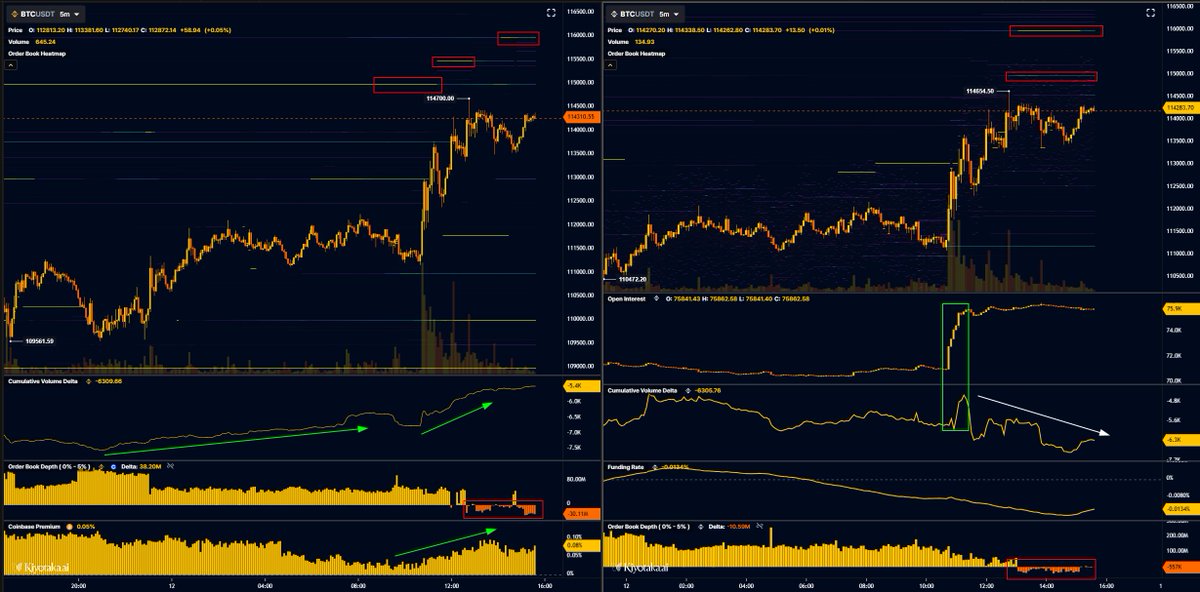
market microstructure (liquidity) how markets move... a thread 🧵

market/limit orders: the market moves solely based on events not time. market order (taker) limit order (maker) stop orders/triggers → triggered at market and most of the time forced with someone being forced out the market (stopped out). note - pattern/breakout traders in

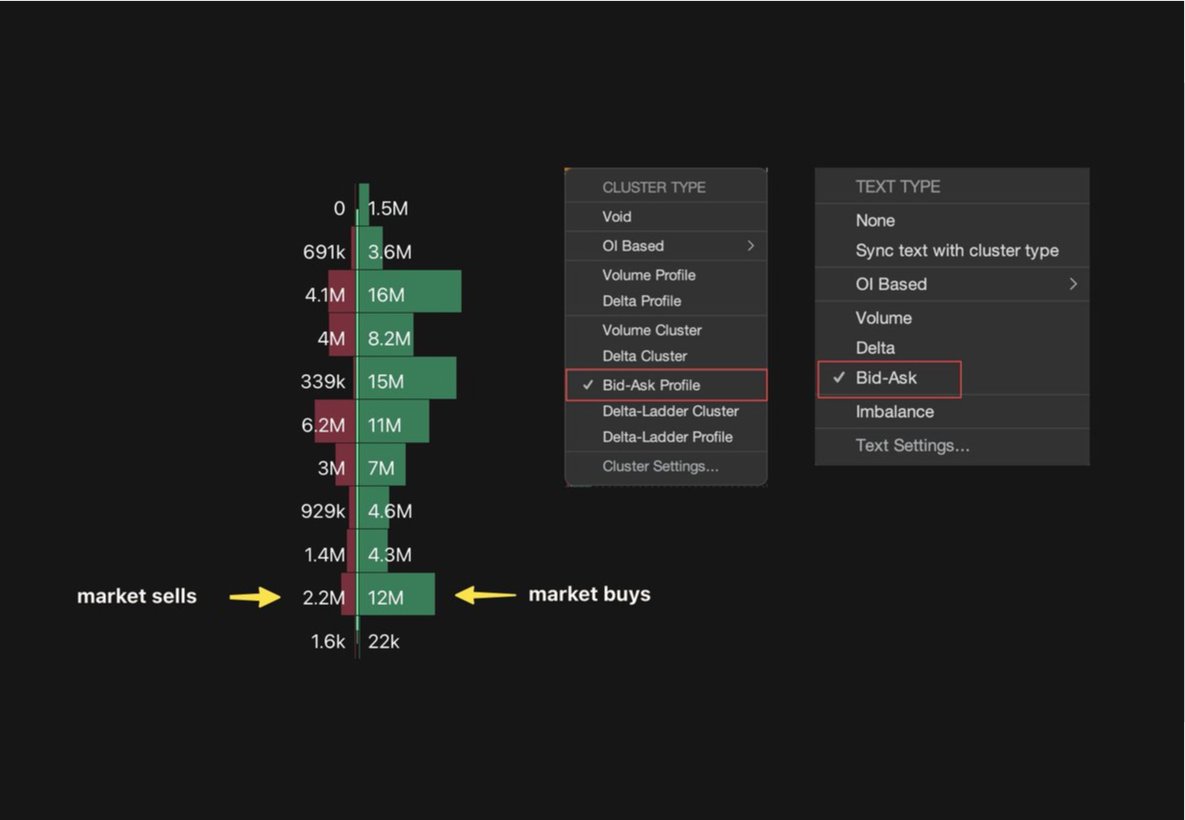
footprint charts: displays ONLY market orders. most common setups is to see market sells on the left with market buys on the right → bid-ask profile I find footprints the best for spotting absorption or exhaustion in the markets as they display already transacted data. i.e
liquidity impact: spread & depth being they key components for understanding how the markets liquidity is being impacted. note - in crypto markets in particular $BTC or $ETH, you will likely see little to no spread exchange dependent. depth is where the primary impact is.

depth of market: simply shows resting limit orders on either side of the orderbook, whilst also displaying live market orders eating into those buy/sell walls. there is also the option to view pull/stack columns which display live feed of each individual level in the orderbook

heatmaps: good for identifying areas of past liquidity and how orders being pulled effect price action. its important to understand that orders can be pulled, heatmaps are not the best visual representation for live resting orders. if you do want to look at heatmaps I would
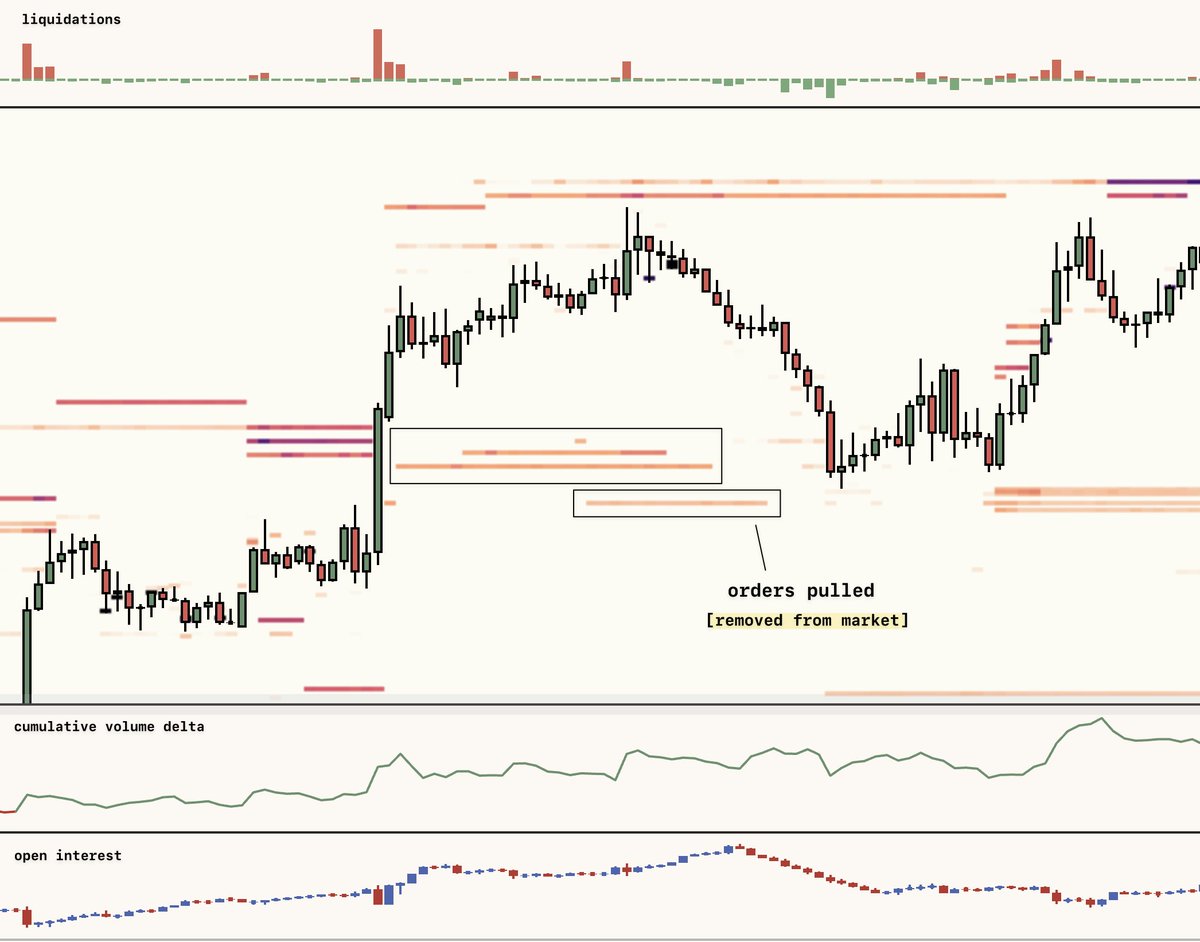
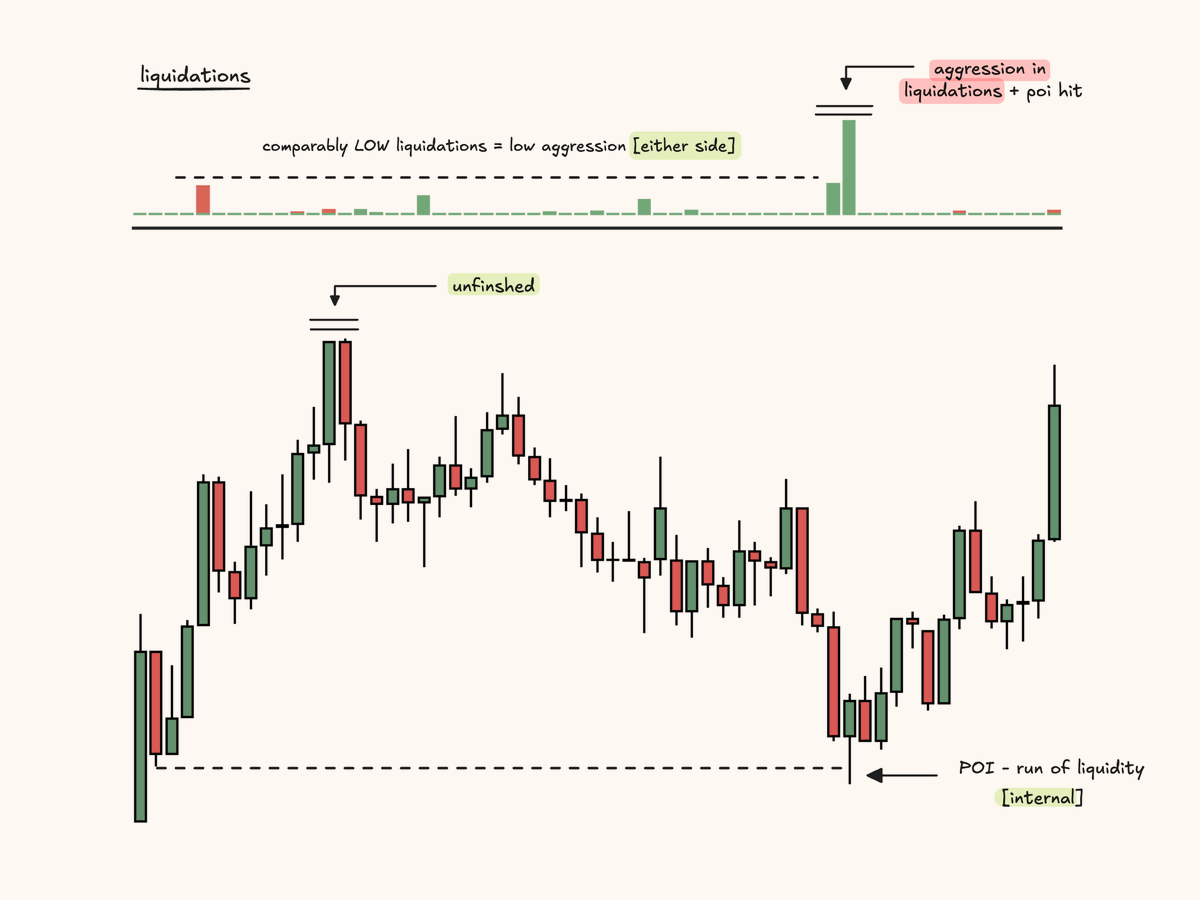
how liquidations work: When a position is liquidated, that becomes the exchanges' position, they must get that delta off their books. With DEX's like @HyperliquidX if someone is liquidated the position is instantly forced onto the books via market order (no middleman). These
Footprint & DOM - @ExochartsC Depth of market heatmaps - @bookmap_pro hope you found this valuable. If you have any questions let me know below.
@Luckshuryy Can I focus on price action and orderflow with volume profile for now ? As an upcoming trader then pivot later to this ?
timelapse of $BTC 30s chart, 116k to 100k hyperliquid liquidations included sound on
you're welcome

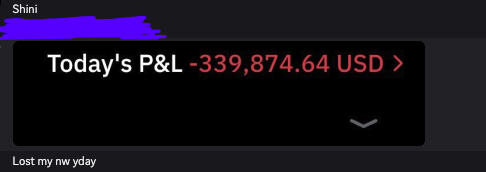
to all those who've managed to lose a bunch of money, it's okay to reach out guys no shame in losing Issa all part of humane life the dump just yesterday managed to wipe out 0.5% of the industry, which is a quite a lot for one day's worth of action we'll see if we can help
$BTC Coinbase driven bounce so far in the market with coinbase premiums leading since yesterday some clear twap buying taking place on binance spot as well from $109K - $114K Some longs opening off "de-escalation" headlines as well however still heaviness in the market with