
Why Downside Correlation Is Always Higher and How It Warps the Vol Surface🧵 Correlation Surfaces and Skew
The Intuition: Volatility Is Not Just About Stocks — It’s About Co-Movement At the index level, implied volatility is a function of both: individual stock volatilities (σi), and their pairwise correlations (ρij).
Formally, for an NNN-stock index: where ρˉ is the average pairwise correlation and σˉ the average single-stock volatility.
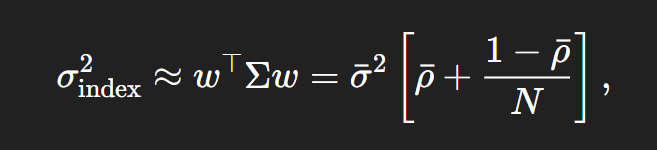
Hence, index vol rises when either single-stock vol rises or correlations rise. This dual dependency is the heart of skew asymmetry across upside and downside markets.
2. The Asymmetry: Why Downside Correlation > Upside Correlation correlation is state-dependent. When the market sells off: Volatility increases across most stocks (negative return–vol correlation), Correlations increase as stocks move together in panic, Hence, index vol rises
This “double whammy” produces steeper downside index skew: The index put wing is bid up due to joint tail risk (systemic), The single-stock put wing is shallower because some idiosyncratic dispersion remains. this creates a “kicker effect” - correlation is the hidden convexity
Conversely, on the upside: Stock moves are more idiosyncratic and sector-specific, Correlations fall (dispersion increases), Index implied vol therefore lags the rise in single-stock vol. Thus, upside correlation trades at a discount, i.e., upside call options embed lower
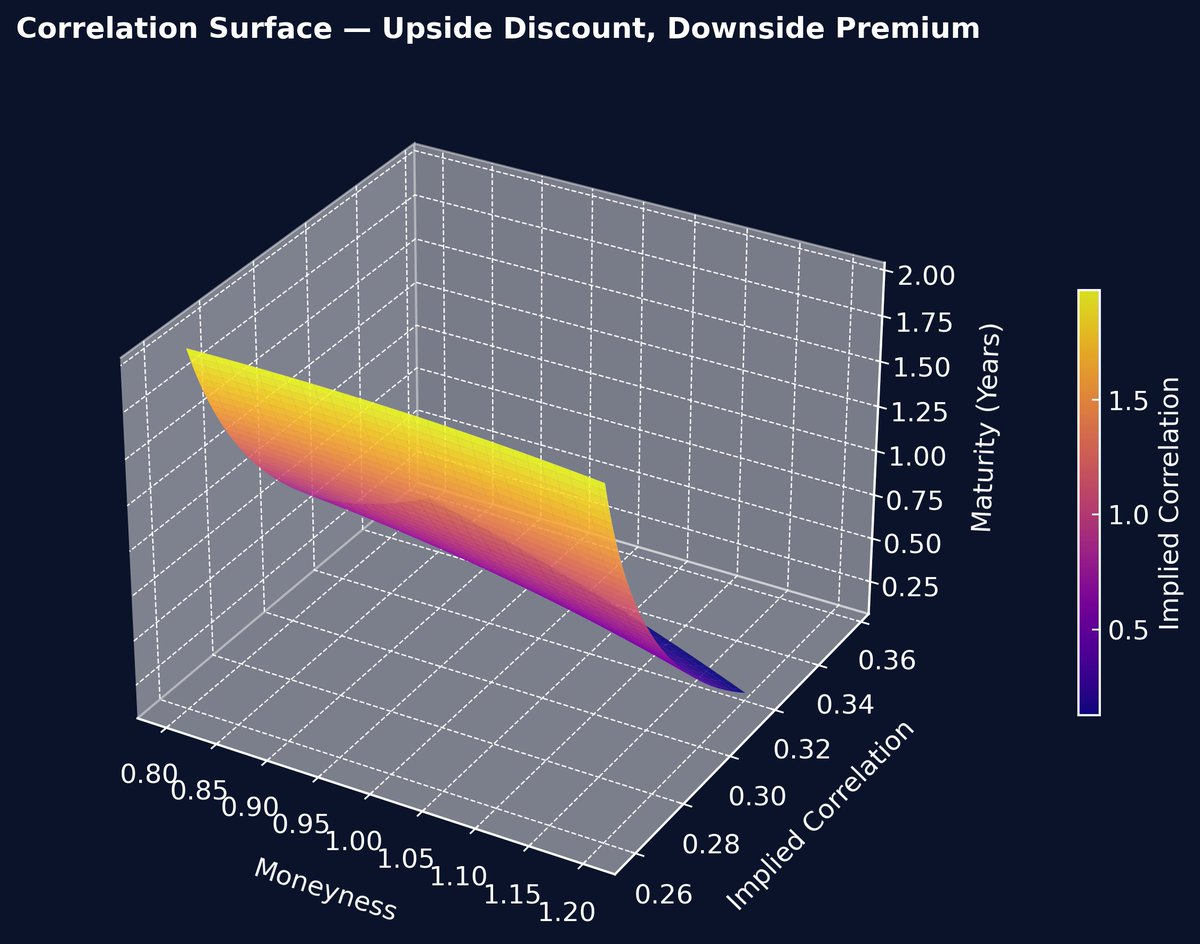
3. The Correlation Surface: Skew + Term Structure Just as volatility has a smile/skew surface, correlation does too
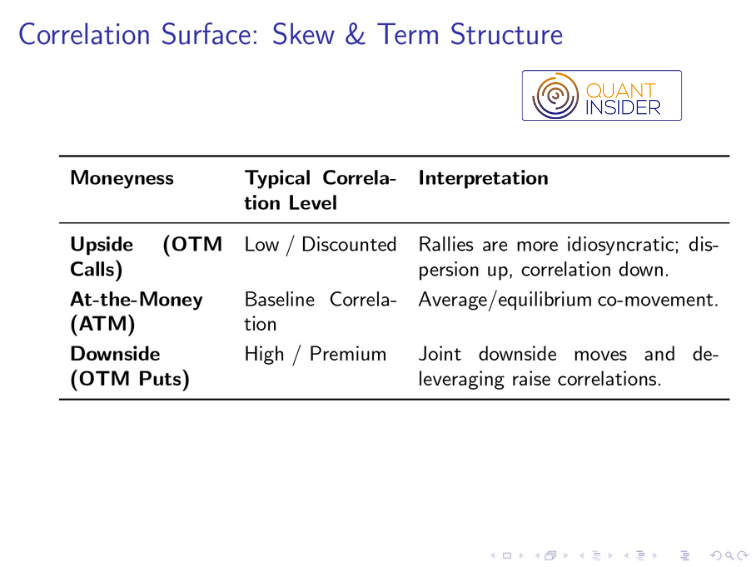
That gives us a correlation skew (downside > upside). Overlaying maturities yields the correlation surface where short-dated correlations react sharply to events, while long-dated correlations tend to anchor around structural averages (e.g., 0.3–0.4 for S&P 500).
Formally:

4. How Correlation Shapes Index vs. Single-Stock Skew Index skew = Stock skew + Correlation skew. On the downside, both stock vol and correlation vol increase → steep index skew. On the upside, stock vols may rise modestly, but correlations collapse → flat or inverted skew.

implying a nonlinear sensitivity of index vol to correlation shifts — also we can call it negative convexity for short-correlation traders
Thus: Being short correlation (e.g., short index vol vs. long basket vol) exposes you to negative convexity: losses accelerate when markets fall and correlation spikes. The risk premium embedded in index vol compensates for that tail convexity
5. The Practical Trading Implications a. Index skew trades richer than single-stock skew → Because both vol and correlation rise in sell-offs, index puts trade at an additional “systemic correlation premium.” b. Upside correlation trades cheap → Call-side baskets tend to be
Summary Takeaway Upside correlation < Downside correlation. Market panic synchronizes stock moves; rallies do not. Index skew is structurally steeper than single-stock skew. Correlation acts as a hidden lever amplifying index vol. The implied correlation surface embeds both