
in the following, I look at the corr between fwd returns (at different horizons) and signals for the top 20 historical mc coins. daily data. I require at least two years of history for a coin to be included. I looked at overlapping, non-overlapping, and vol normalized fwd
ICs are close to zero at very short horizon (1-day), consistent with the dominance of noise in daily price movements and laggy signals
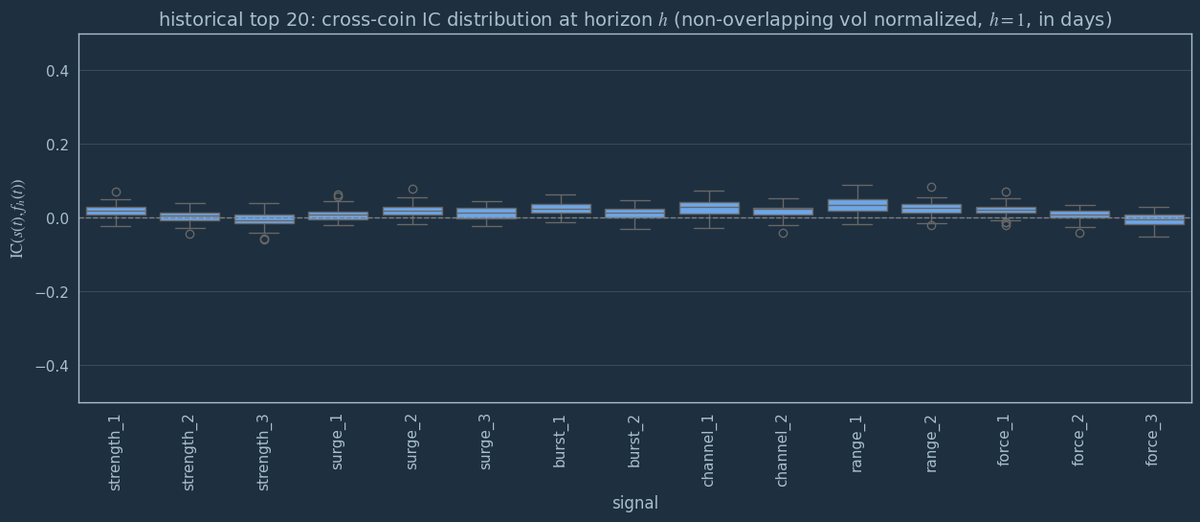
ICs tend to increase with horizon and most signals appear to peak around 20–30 days, after which correlations generally weaken and dispersion across coins increase (also fewer non-overlapping samples play a role here)

here is the mean IC over top 20 historical mc coins for 3 EWMAC trading rules (fast, medium, slow)

and for range (=bollinger, fast, slow)
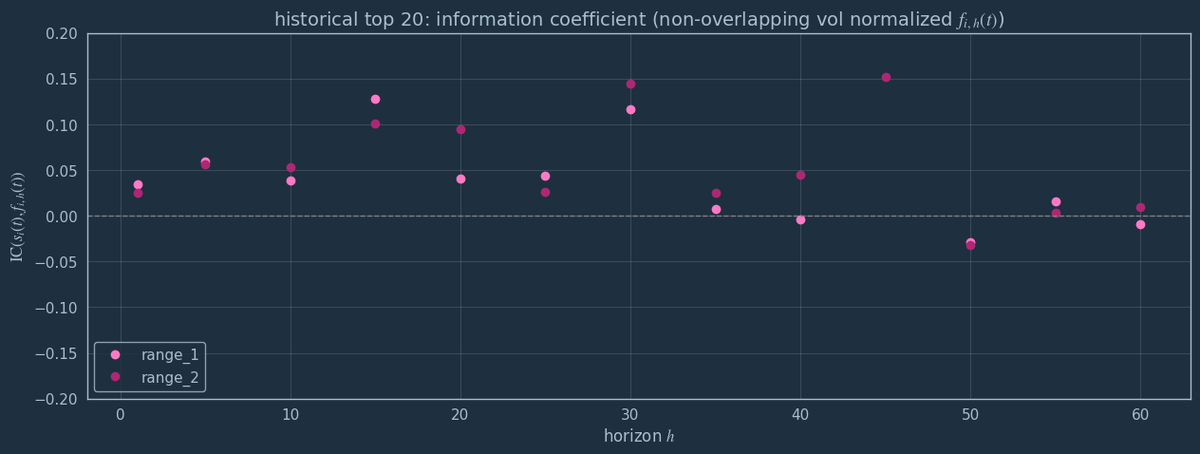
preliminary conclusions for signal selection: (1) trend is a weak edge, as indicated by low ICs, but it appears to be systematic in the data (2) faster / medium signals have typically higher ICs than slow signals, maybe crypto specific (3) most trend signals I looked at contain
This is why we don’t let pure engineers trade btw
I hope this is satire. but if you ever see an equity curve like this, the only assumption is that it's wrong. also if there's a quote like that on top of it, bragging on social media, it definitely ain't real.
I don't get the urge to call out nonsense bc the mosquitos keep coming but I do appreciate Scott, @bennpeifert and others who do. My view is a bit Darwinian

Public service announcement: momentum and mean reversion strategies do not look anything remotely like this, ever, no matter what, you do not need to check the details. Don't engage with charlatan course sellers