
In this THREAD I will explain “Liquidity” 1. Where is the Liquidity? 2. Types of Liquidity 3. Fibonacci Levels 🧵(1/12)

1. Where is the Liquidity? There are two types of Liquidity: Buyside Liquidity (BSL) and Sellside Liquidity (SSL)

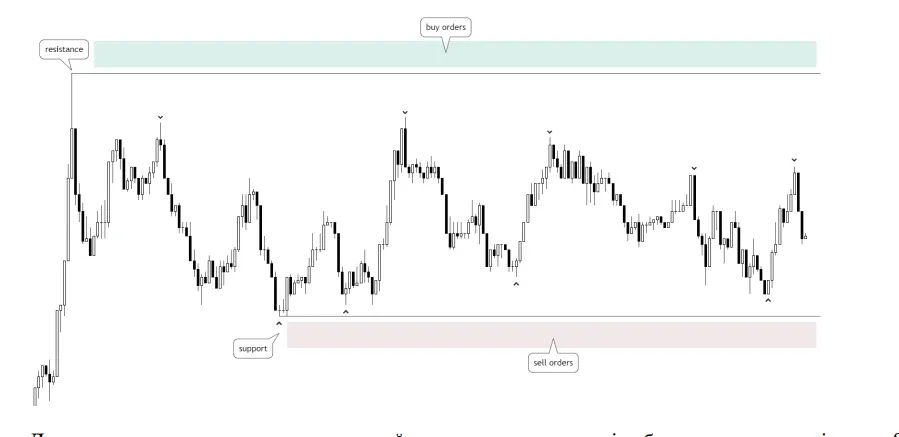
1.1 Where is the Liquidity? BSL represents stop-loss orders for short sellers, typically located above previous highs. SSL represents stop-loss orders for long positions, found below previous lows.

1.2 Where is the Liquidity? Support and Resistance levels are a key tool for finding entry points for trades and liquidity. Liquidity is building up above and below the highs and lows.
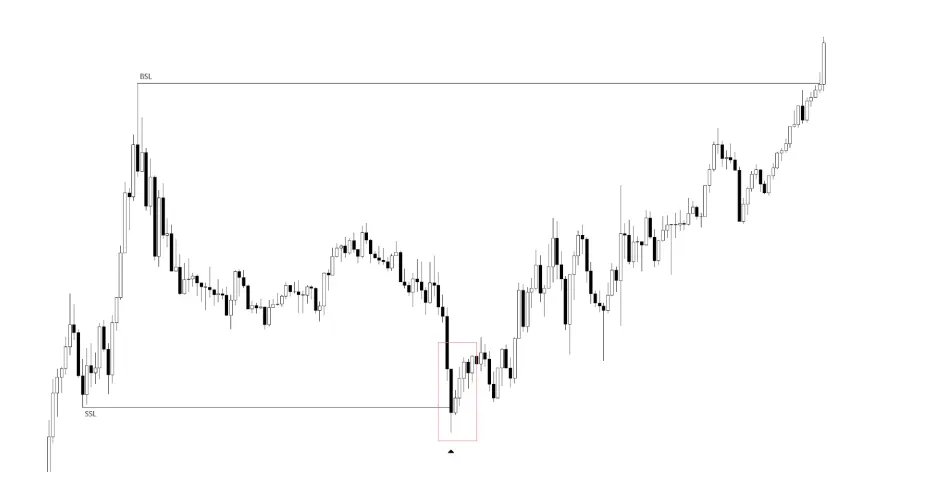
1.3 Where is the Liquidity? Liquidity Sweep/Raid Price tends to move towards areas where there’s a higher concentration of liquidity. The majority of liquidity is found beyond Swing Highs and Swing Lows.

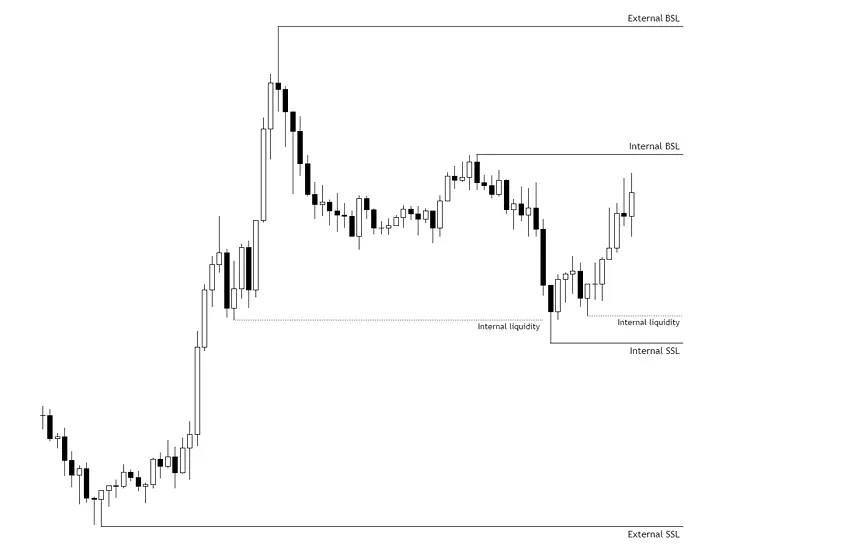
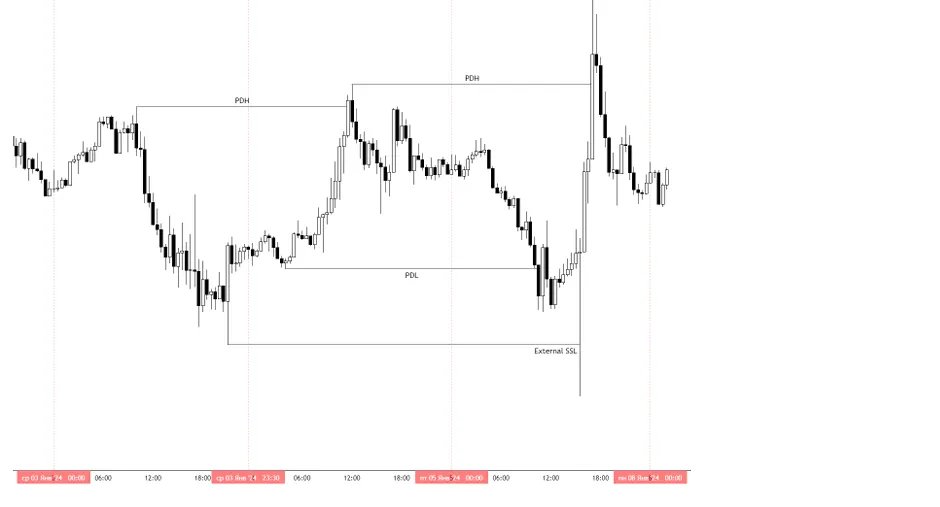
2. Types of Liquidity Internal liquidity refers to price levels and imbalances within a defined range, often appearing as FVG External liquidity refers to price levels outside that range, such as old highs or lows (swing highs and lows)
2.1 Types of Liquidity The Highs and Lows of the previous month/week/day are strong liquidity accumulation zones. PWH/PWL: Previous Week High (PWH) / Previous Week Low (PWL)
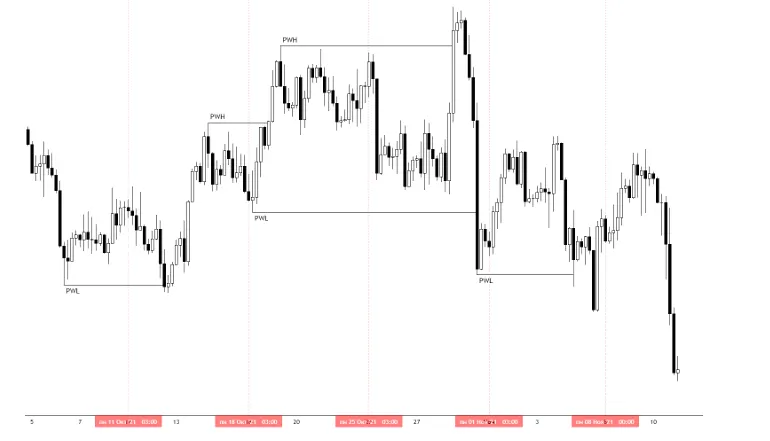
2.2 Types of Liquidity Most often, these levels will be intraday targets for price movement. PDH/PDL stands for Previous Day High and Previous Day Low, respectively.
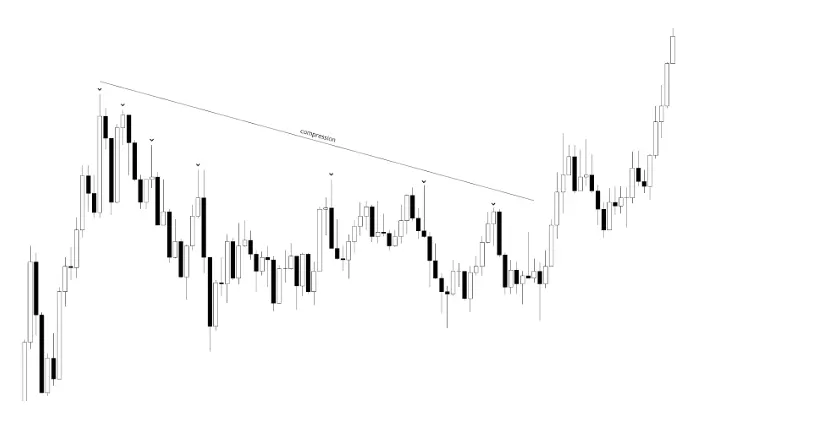
2.3 Types of Liquidity Compression: A compression period can create a high-potential "fuel zone" where a sudden breakout is anticipated. Liquidity will be formed at these points, which will be of interest to large market participants to continue the initial movement.
3. Fibonacci Levels Fibonacci levels represent potential areas of liquidity when they align with other technical factors. Such as previous support or resistance levels, or the highs and lows of previous trading days

3.1 Fibonacci Levels Liquidity pools form above or below key levels (0.236–0.786) Price often wicks into these zones to grab liquidity before reversing. This shows how Fibonacci Levels act as liquidity magnets.

3.2 Fibonacci Level When a trading range is formed we can always observe these three elements: The Premium zone, the Discount zone, and the Equilibrium zone. Liquidity often rests above premium highs and below discount lows.

@SoulzBTC Nice job done by soulz
@SoulzBTC This very important educational post specially on Fibonacci because it's key also
@SoulzBTC Nice Concepts
@SoulzBTC Thanks so much for this 💖🎉
@SoulzBTC I still wonder why I enjoy reading trading pdf than school books
@SoulzBTC Thanks much.
@SoulzBTC Good one 💪 Fib levels/premium-discound zone + daily lows/highs my bread and butter
@SoulzBTC Soulz posts: 1. Simple to understand 2. Educational, as in straight to the point 3. Make people enjoy trading Just 1578689877677x10-27° posts more & we're all proffesionals 😁
@SoulzBTC Thank you Mr great soulz
@SoulzBTC Thanks mate 🙏
@SoulzBTC Great job, added to favorites!!
@SoulzBTC @threadreaderapp unroll
@SoulzBTC Simple,crisp and non confusing post Keep them rolling Soulz
@SoulzBTC Great 👍
@SoulzBTC 🙌🙌🙌🙌🙌
@SoulzBTC Thank you for the alpha
@SoulzBTC Thanks for sharing legend, this is really educative Bookmarked to study it dip