
$NVDA LIVE EXAMPLE and how Market Maker has to re-adjust UNDERSTAND GAMMA/VANNA and dynamics of MM like never before Is it a chase? Are they offsides? This example is exposure as of 10/28 close $NVDA What to watch for after open 🧵
Thread/2: See pic 1 below Screenshot showed exposures as of 10/28 Market close (4 PM EST) The values represent net GEX for each strike and net $(Notional) value Lets discuss Strike 1(10/31): NET $GEX) Purple NODE 205/207.5 (-17M and -16M) S1 Pic 1 Neg Gex implies combo of
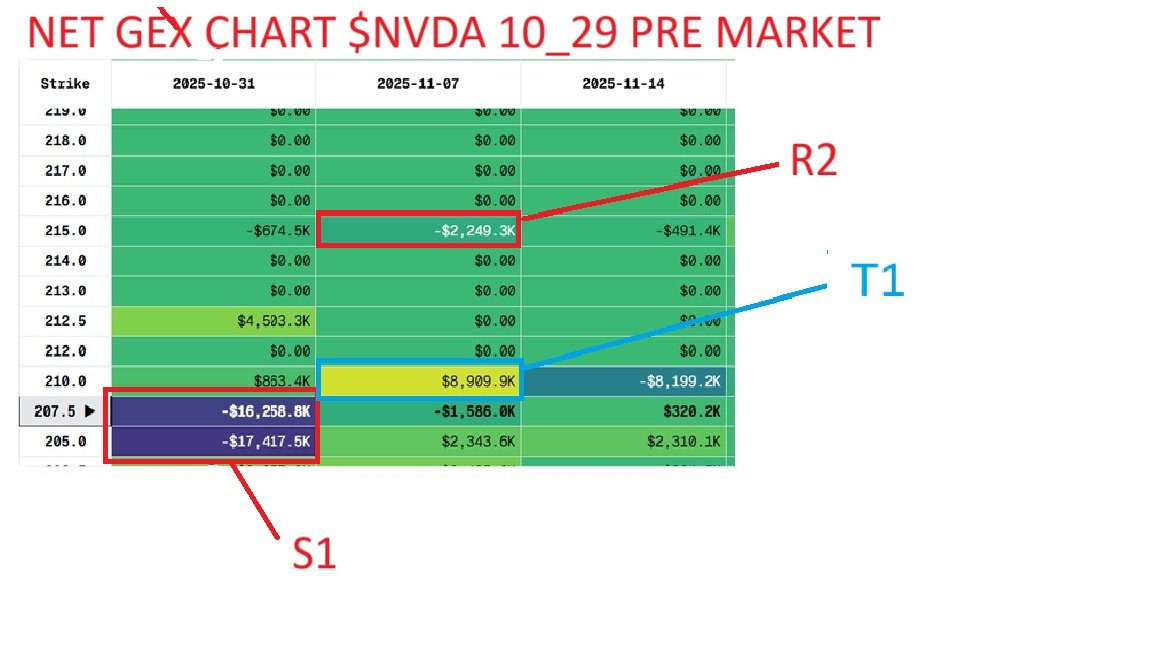
🧵/3: What happens once $NVDA opens > (-) short GEX strikes 205 and 207? Traders are offsides due to DELTA being ITM(from OTM)- IE con was (-.40) and now could be (-.80) delta (Con is ITM and growing so delta grows more (-) since they have a combo of being against the move UP
🧵/4: What's the result? -Strikes will eventually go down in (-) and could turn (+) as time progresses, as (-) gex rolls off and (+) GEX and ITM deltas take over(IE $NVDA is higher and contracts below are ITM(CALLS ETC) and that value > bear value thus driving net gex to a less
🧵/5: Lets discuss Strike 2(11/7): NET $GEX T1- $210 Pic 1 Thread/2 This node is target for $NVDA 11/7 and highlighted yellow $NVDA being ~207 or close, increases this exposure GEX NOTE: Was 8.9K at close, expect it to be higher R2: -$2.2K $215 Pic 1 Thread/2 What happens
🧵/6: What about R1?- Pic 1 on Thread/2 Same concept on short side but still slightly OTM deltas so not as much pressure against it unlike $205/$207.5C It would be more (-) than $2.2K but could also quickly flip if traders exit and or OTM calls come in creating (+) GEX
🧵/7: $NVDA NET VEX Chart as of 10/28 COB $NVDA~ 207 $NVDA 210: + VANNA(IF VOL drops, sell stock) $NVDA 215: (-) VANNA(VOL drops, buy stock)
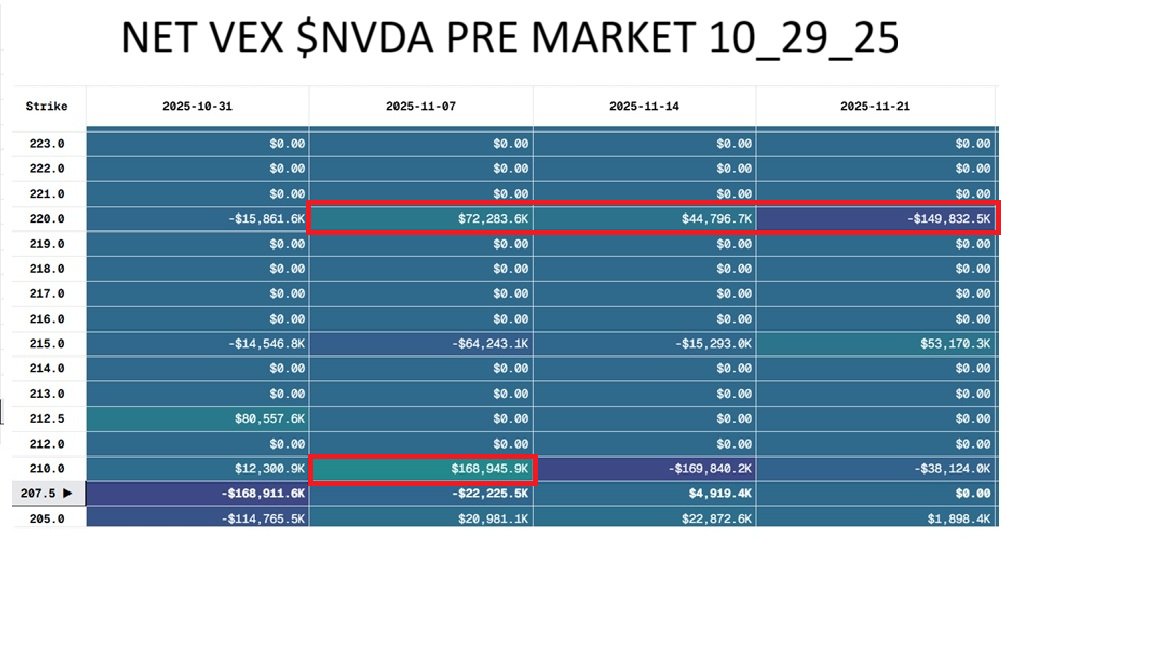
🧵/8: $NVDA rallies up(This am) The $210 strike transitions from OTM call to ATM/ITM call. The $215 strike moves from further OTM to near-the-money. As delta on those calls increases, the exposure shifts across strikes: Dealers who were short calls at $215 now have delta
🧵/9: But as price moves toward $215, the negative vanna region becomes more dominant, creating a positive feedback loop (dealers buy more as price rises). That’s why you often see momentum acceleration through strikes with large negative vanna notional exposure.
🧵/10: $NVDA and IV(VOL-VANNA)- If IV increases across strikes(#8-10 was IV dropped); If vanna > 0 and IV ↑ → hedgers SELL underlying (resist the price move). If vanna < 0 and IV ↑ → hedgers BUY underlying (support the price move).
🧵/11: What you might see as $NVDA approaches $210 today, 10/29 or through 10/31 1.) As price - $210: Dealers sell if IV UP, acting as a break/resistance 2.) IF >$210 & towards $215- dealers BUY if IV UP, producing support as VOL rises 3.) Then take into account net "GEX"
🧵/12: This is using a tool called @SkylitAI , hope this thread helps. GOAL: After open, use the chart and see how values change, nodes change, nodes appear and either grows up the chain or below Hope this thread helps. Not financial advice. @Glitch_Trades @mattydaytrades_
@astocks92 This was pretty sexy
@astocks92 Great thread. For someone newer to options with limited knowledge, what books or other resources (other than your profile) would you recommend reading to learn more and work on having the same understanding of the option world etc that you have?