
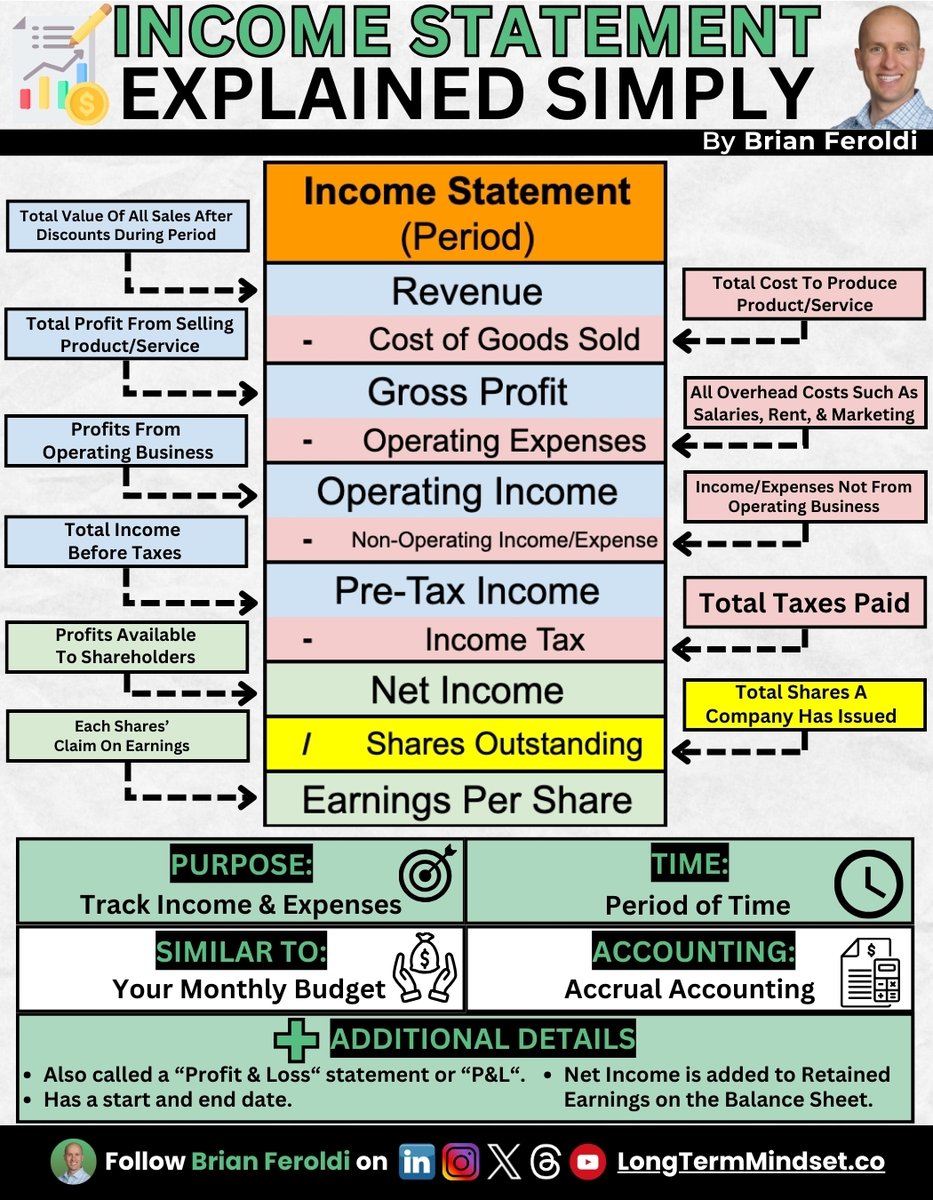
The P&L Statement, Visualized. If you're in business, you MUST understand how a Profit & Loss Statement works. Here's everything you need to know:
The P&L (or Income Statement) shows a company's profitability at multiple levels over a period of time using accrual accounting. Its purpose is to track a company's revenue, expenses, and profits. Here is a "typical" layout and what each term means:
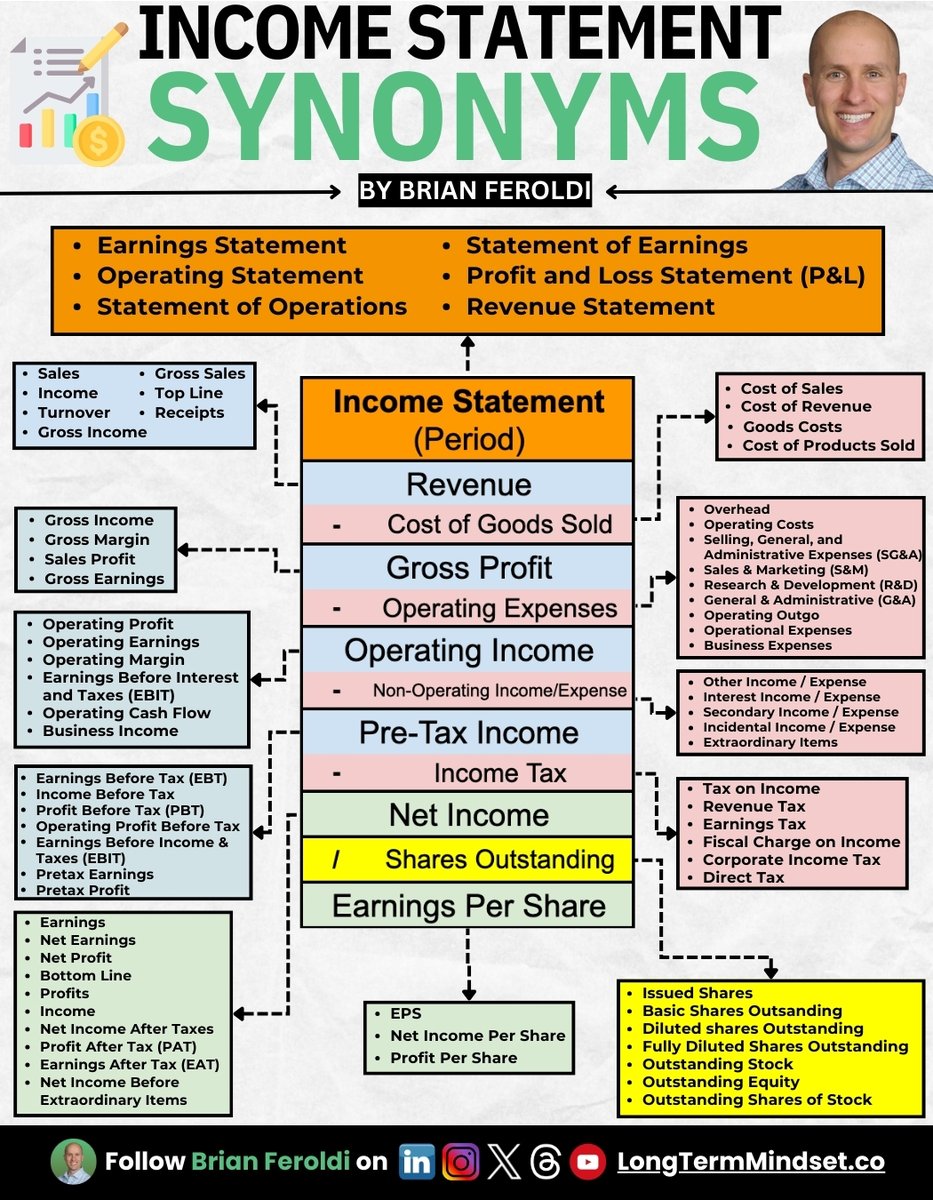
Management teams control the layout & terms used in their P&L. Here's a full list of synonyms you might see:
To analyze a P&L, focus on changes in MARGIN. Margins are the difference between the cost of producing something and the price it is sold for. The most important ones are gross margin, operating margin, and net margin.

Here are some yellow flags to look for when analyzing a P&L.

Here are the "rules of thumb" that Warren Buffett uses when analyzing a P&L.

Like these visuals? You'll love my accounting infographic ebook. Get your free copy here:

If you enjoyed this thread, follow me @brianferoldi. Want to share this with your followers? Retweet the first tweet below: