MY BEGINNERS GUIDE TO VOLUME... & WHY IT'S THE BEST INDICATOR ON THE PLANET🌎🌎 Volume is the one indicator that I use for every single trade I take. This thread will teach you how to use it 🧵👇
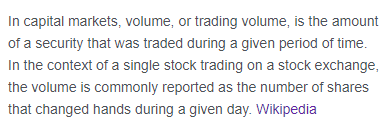
Volume Definition Volume is the number of shares traded over a period of time For example, each daily candle contains the number of shares traded on that day Wordy definition👇
When Bill sells 1 share of $TSLA to Sally that counts as 1 volume
Before we get to deep into the thread, I have one request Drop a ❤️ on the top post of this thread if you enjoy them I work my ass off to build these & make them accessible for beginners. I hope they help🤝
Each of these bars at the bottom of your screen represents the volume for one period of time If I'm on a daily chart, one bar represents the volume from one day If I'm on a 5 min chart, one bar represents the volume from one 5 min candle
Why Volume Is Important Traders can determine the significance of price action based on volume. We can pair it with other indicators to determine strength, reversals, trend, etc

Volume is also real time, or very close, which is different than many other trading indicators Many indicators lag, but volume can be seen as it's happening, which is huge for entering & exiting trades
The importance of knowing how many shares are being bought/sold is IMMENSE Just think about it... we are getting to see the current strength dynamic between buyers & sellers (after we analyze price paired with volume)
How Traders Use Volume: 1) Volume Price Analysis 2) Volume Surges 2) Volume Trends 3) Confirmation
Volume Price Analysis (VPA) is the process of using both volume and price action to make inferences about the future price (I have posted a ton of education about VPA)

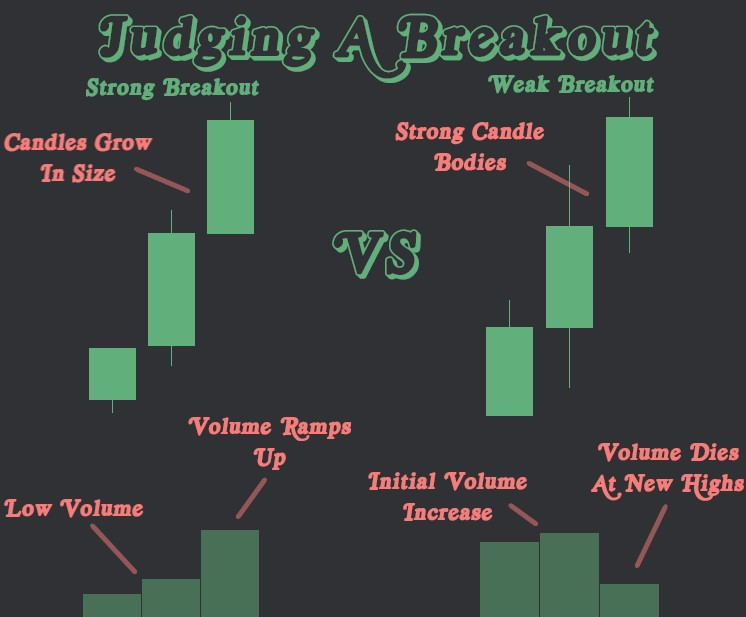
Volume Price Analysis combines candle size & formation with volume Large volume = significant candle Large volume + large body = strong candle Small volume + large body = weak candle I am constantly using VPA to analyze price action & charts
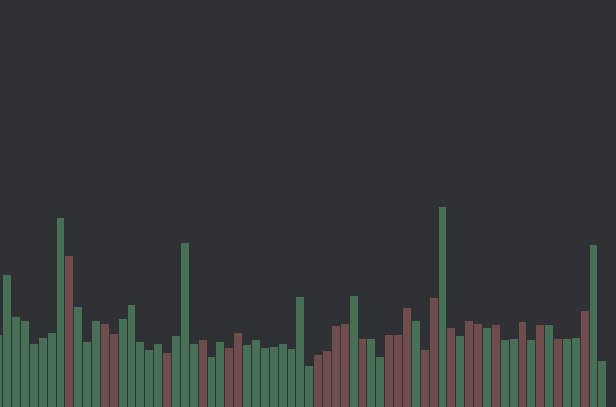
Volume Surges occur when a candle has much higher volume than the previous candles Volume surges indicate significant action. We can extract information about the trend/strength from the candles attached to these volume surges
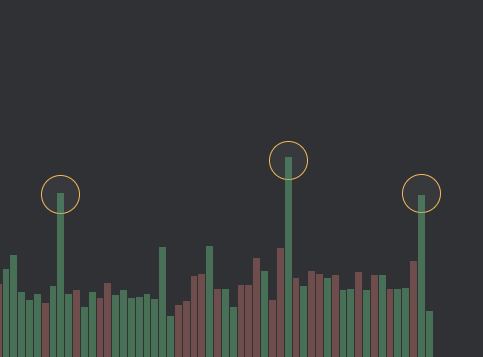
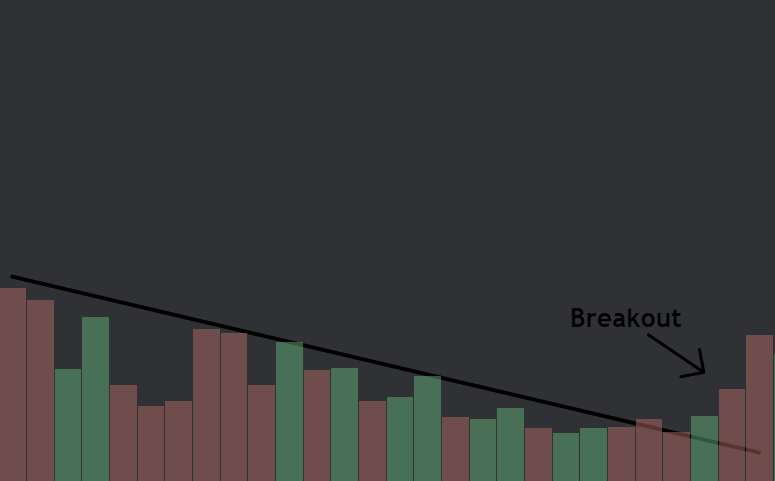
Volume Trends are formed when the overall volume is declining or increasing Volume Trends tell us information about the current price trend. We can also wait for a break of the Volume Trend
Confirmation is one of the best ways to use volume If a move happens with high volume, that move is confirmed. If a strong move happens with low volume, that move is not confirmed
Volume can also be used to confirm losses when a setup fails For example, If I enter on a low volume pullback & then we see a higher volume candle against me, that confirms the pullback is more likely to be a reversal
If you want to see real time examples, sub to me here on X. I post chart analysis, swing setups, day trading ideas, etc It's only $10 a month If you're interested, click the pink button on my profile

THANK YOU FOR BEING THE BEST COMMUNITY HERE ON X I hope this thread was helpful. If you have any questions, hit me up